Latin
Data Methdology
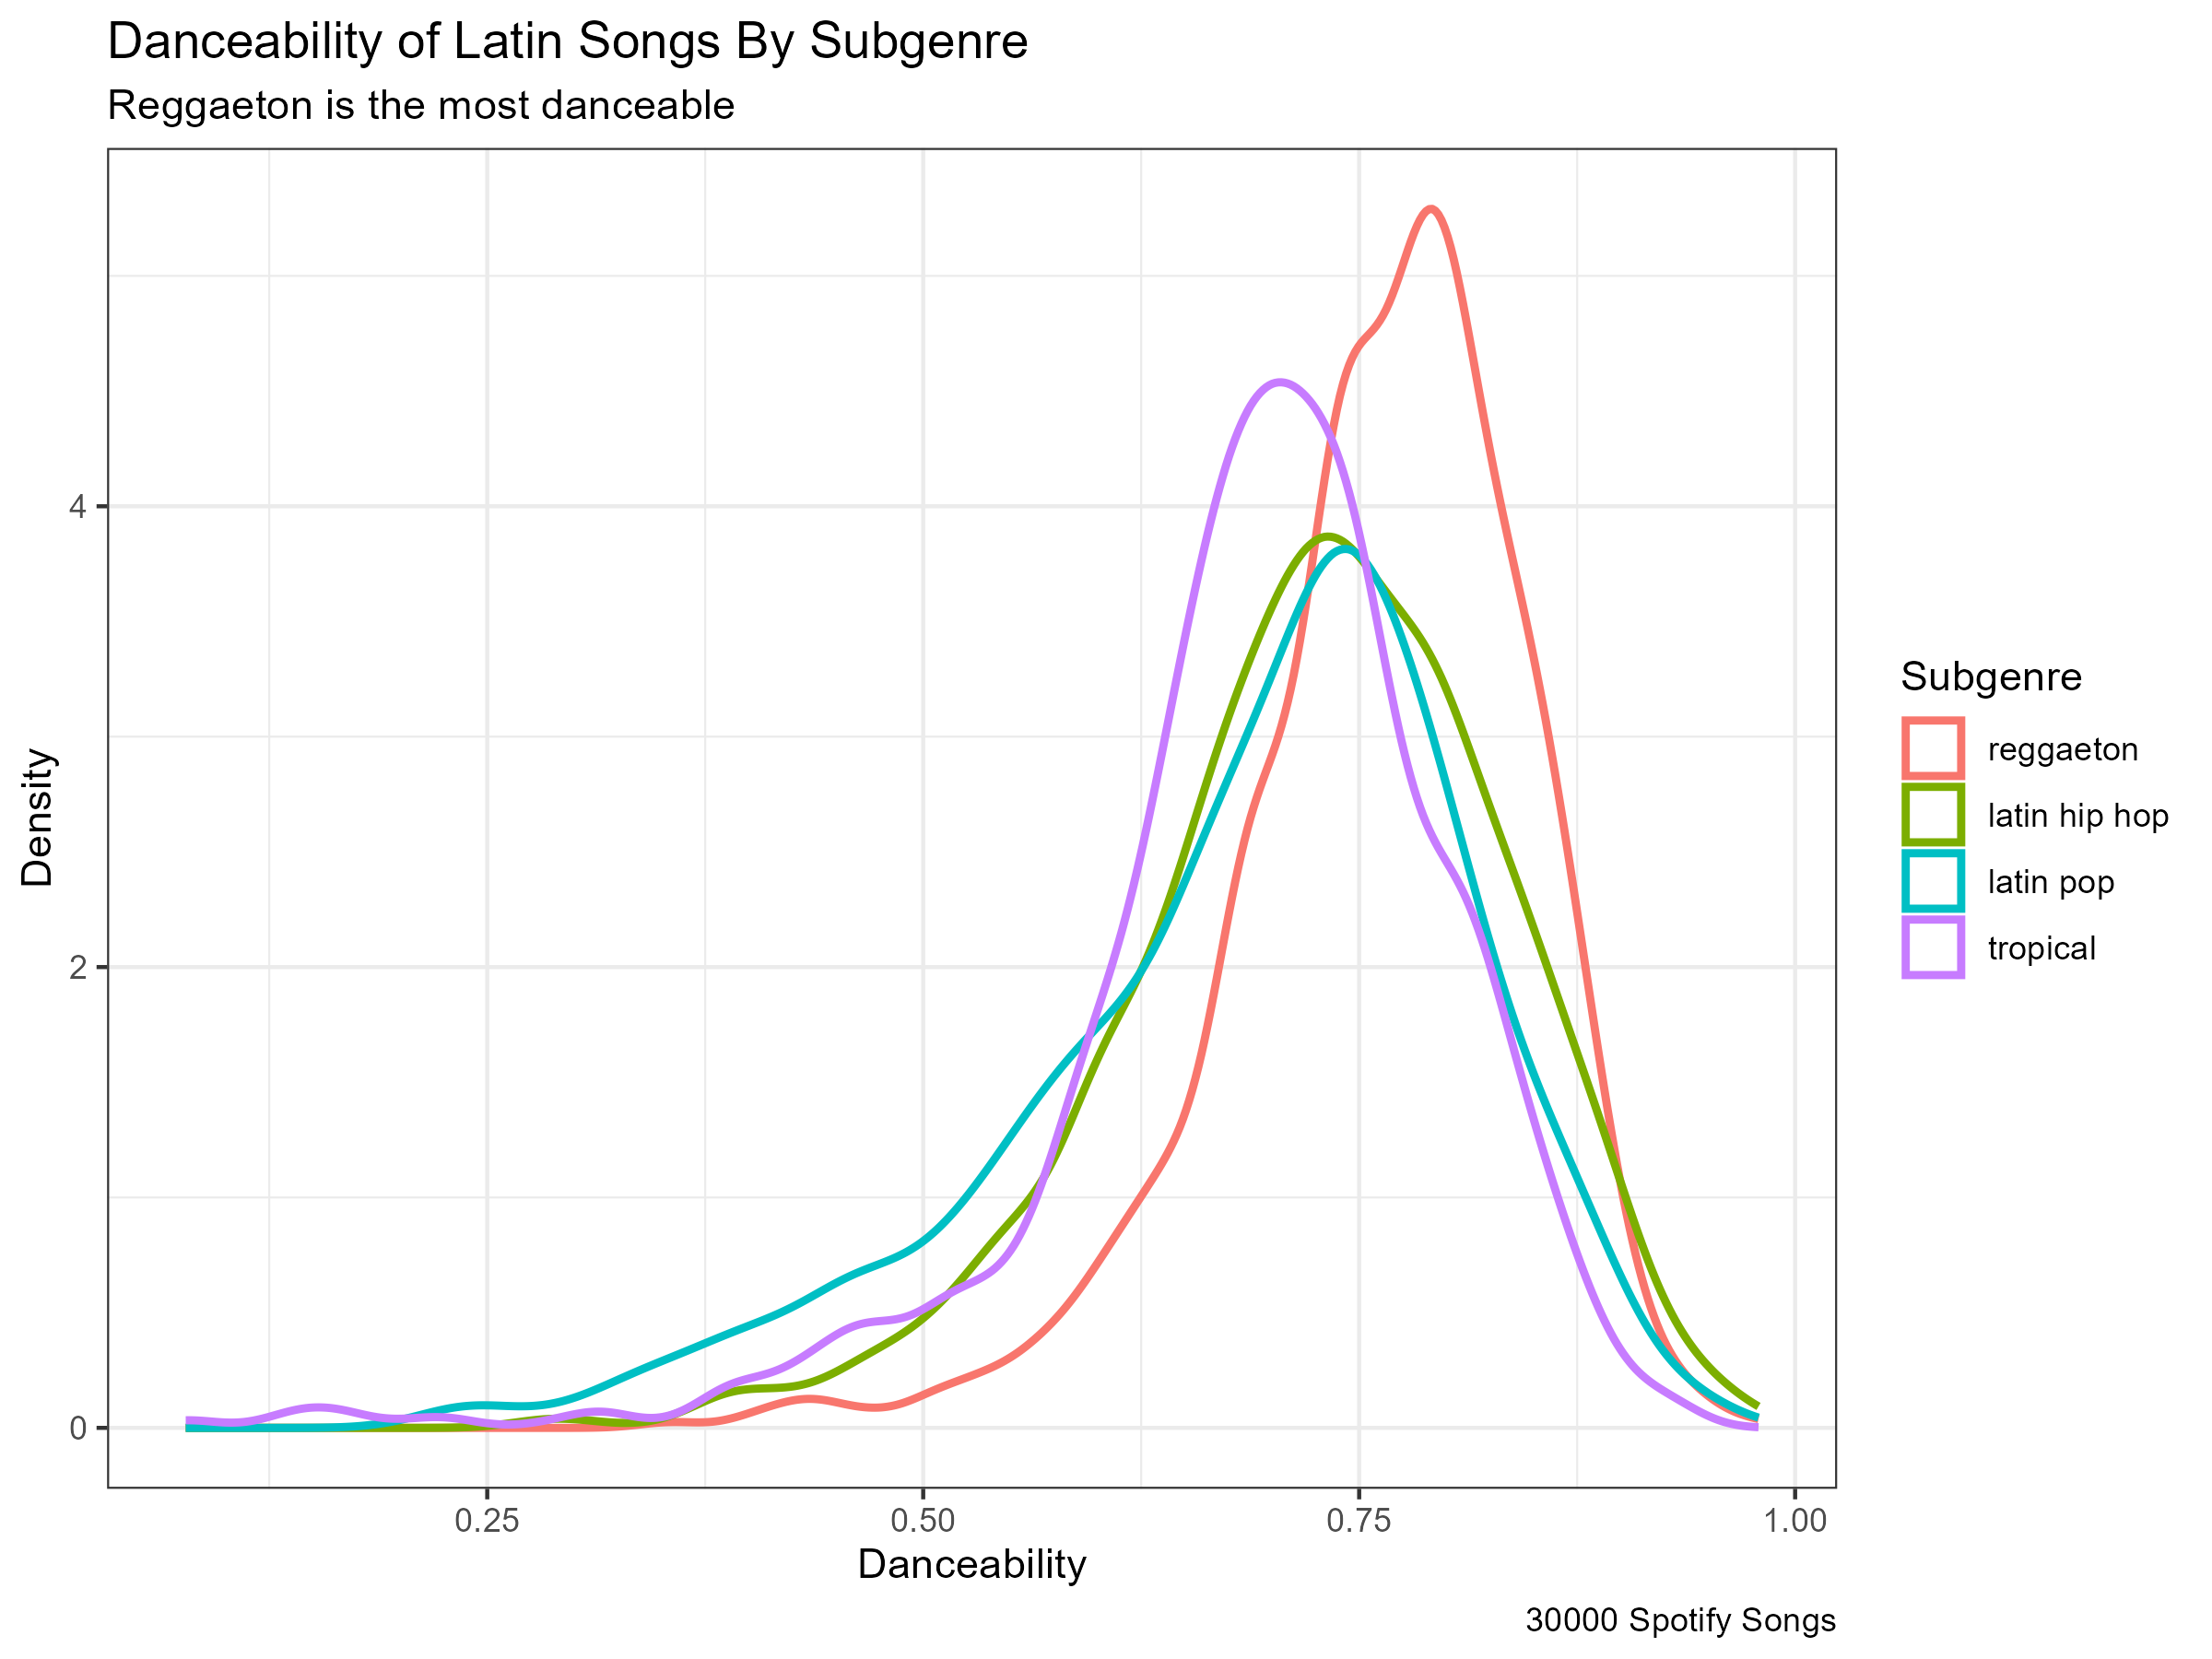
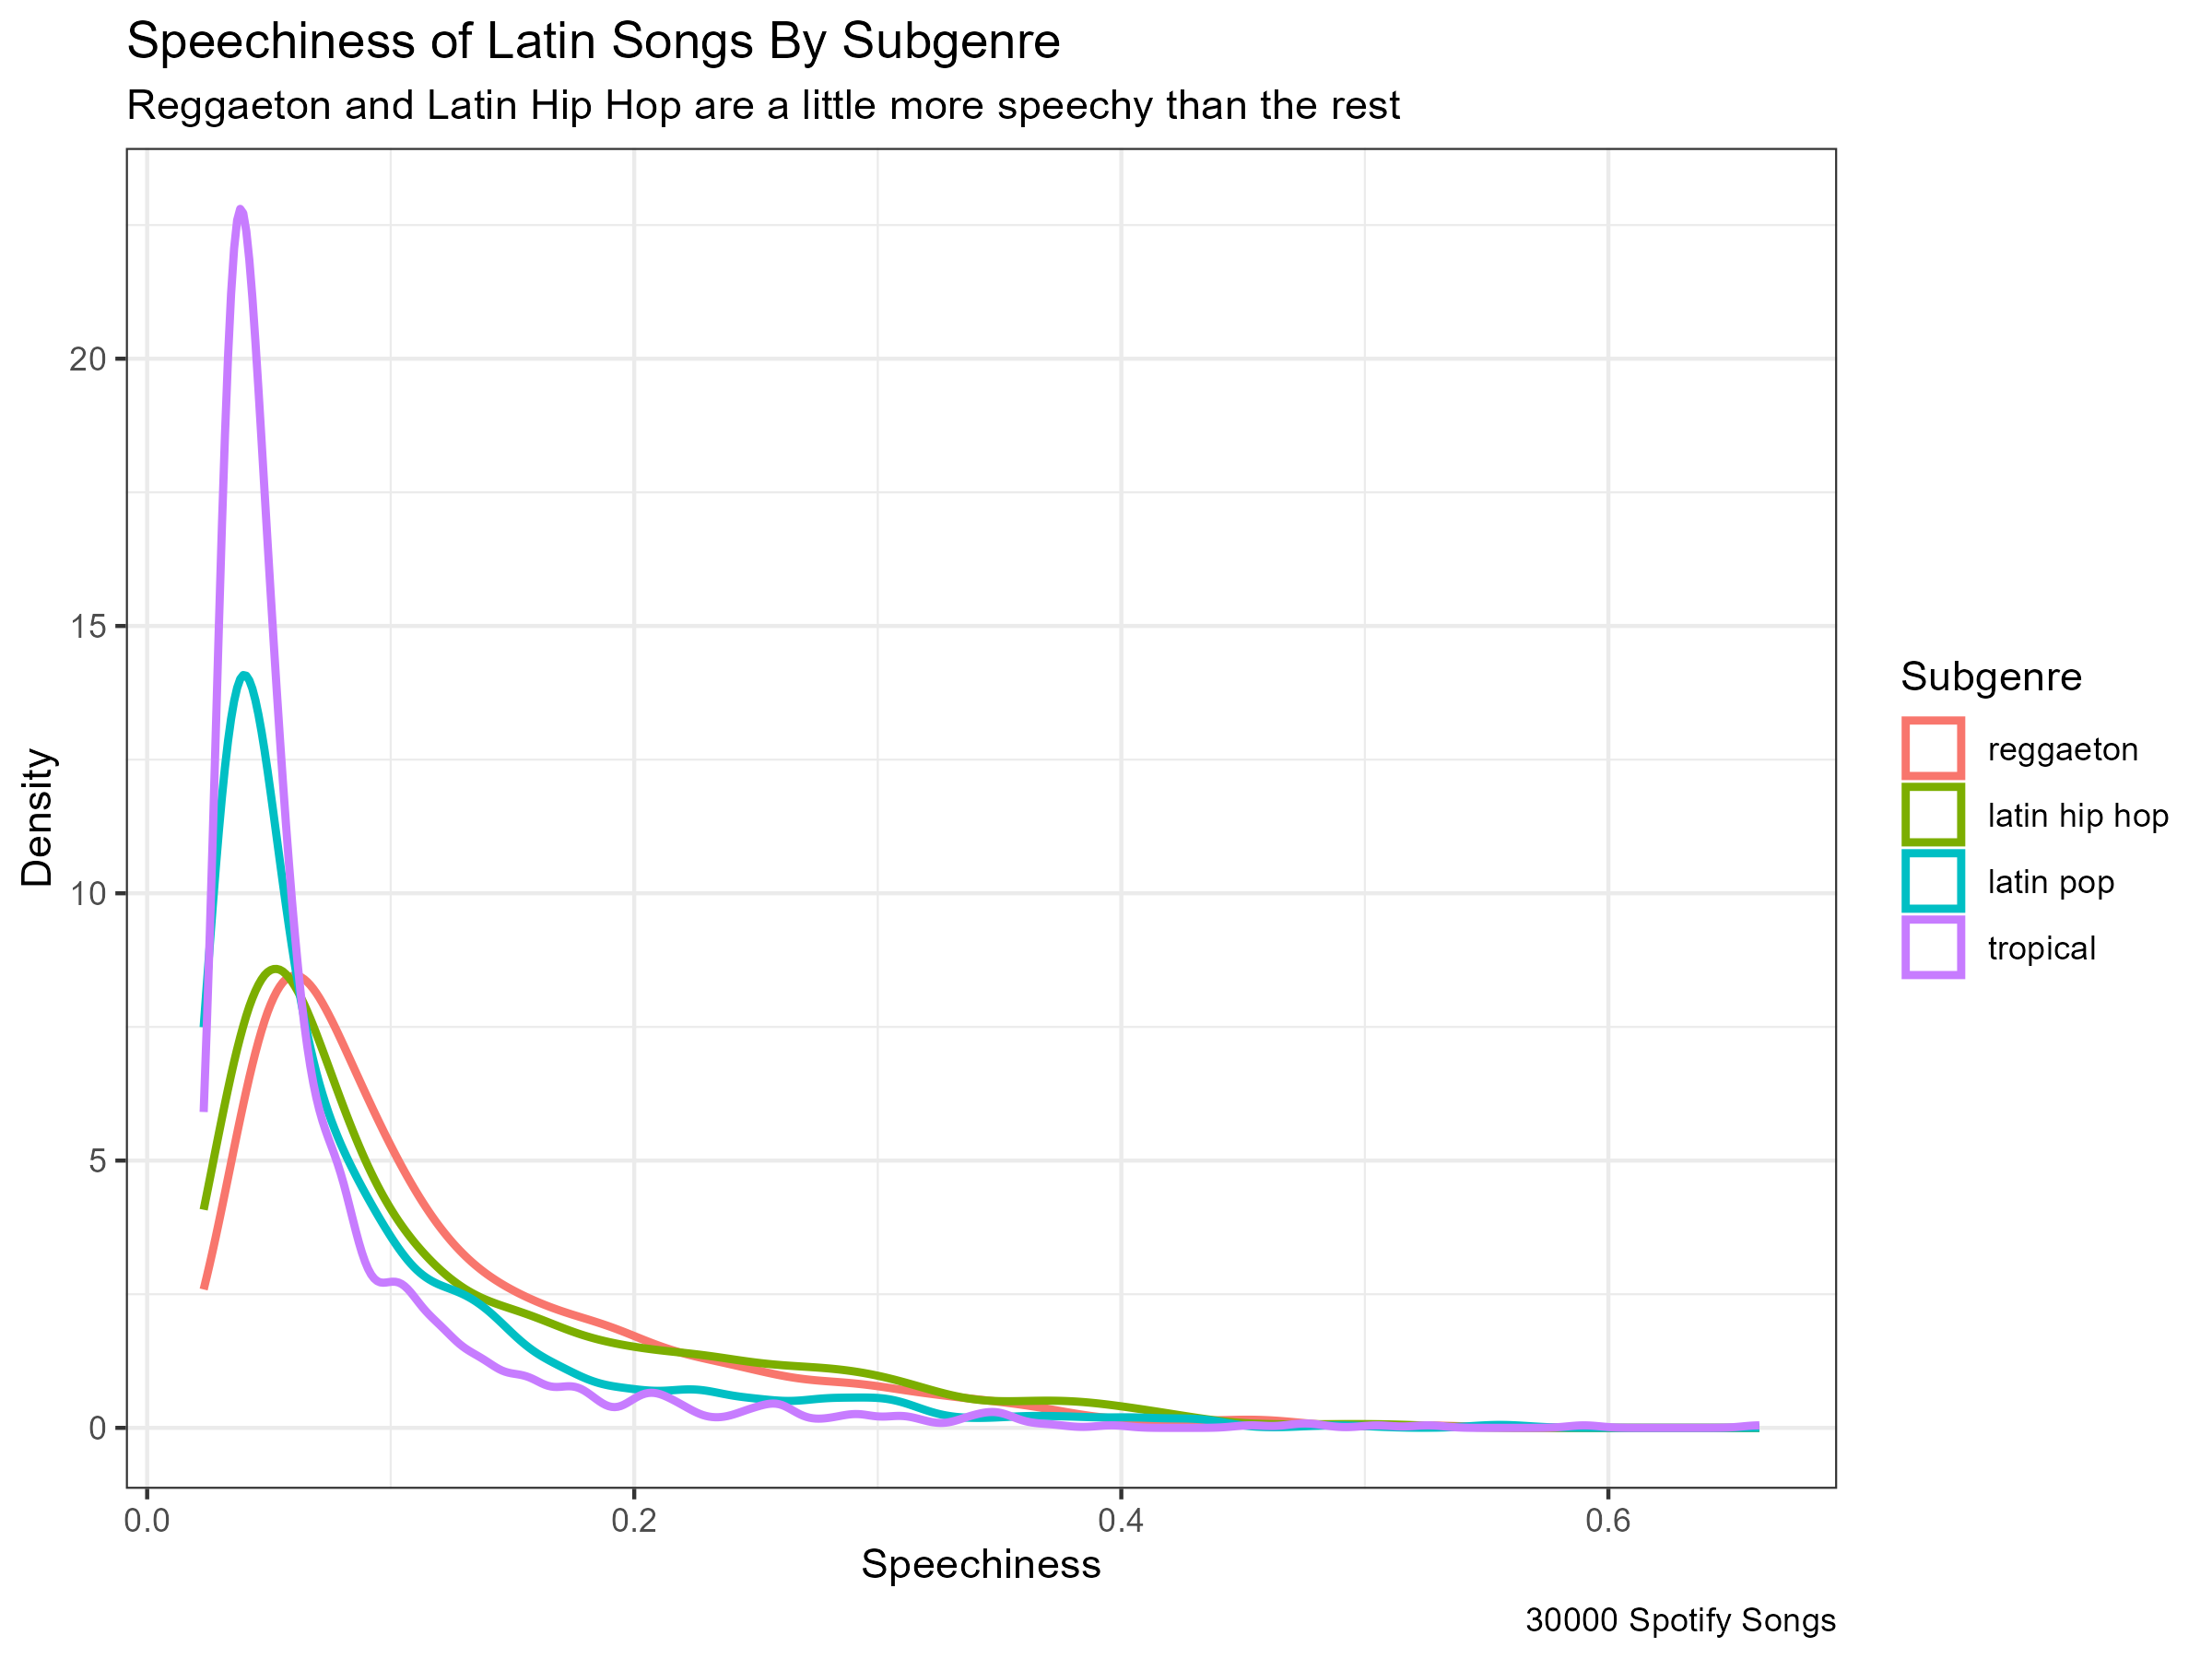
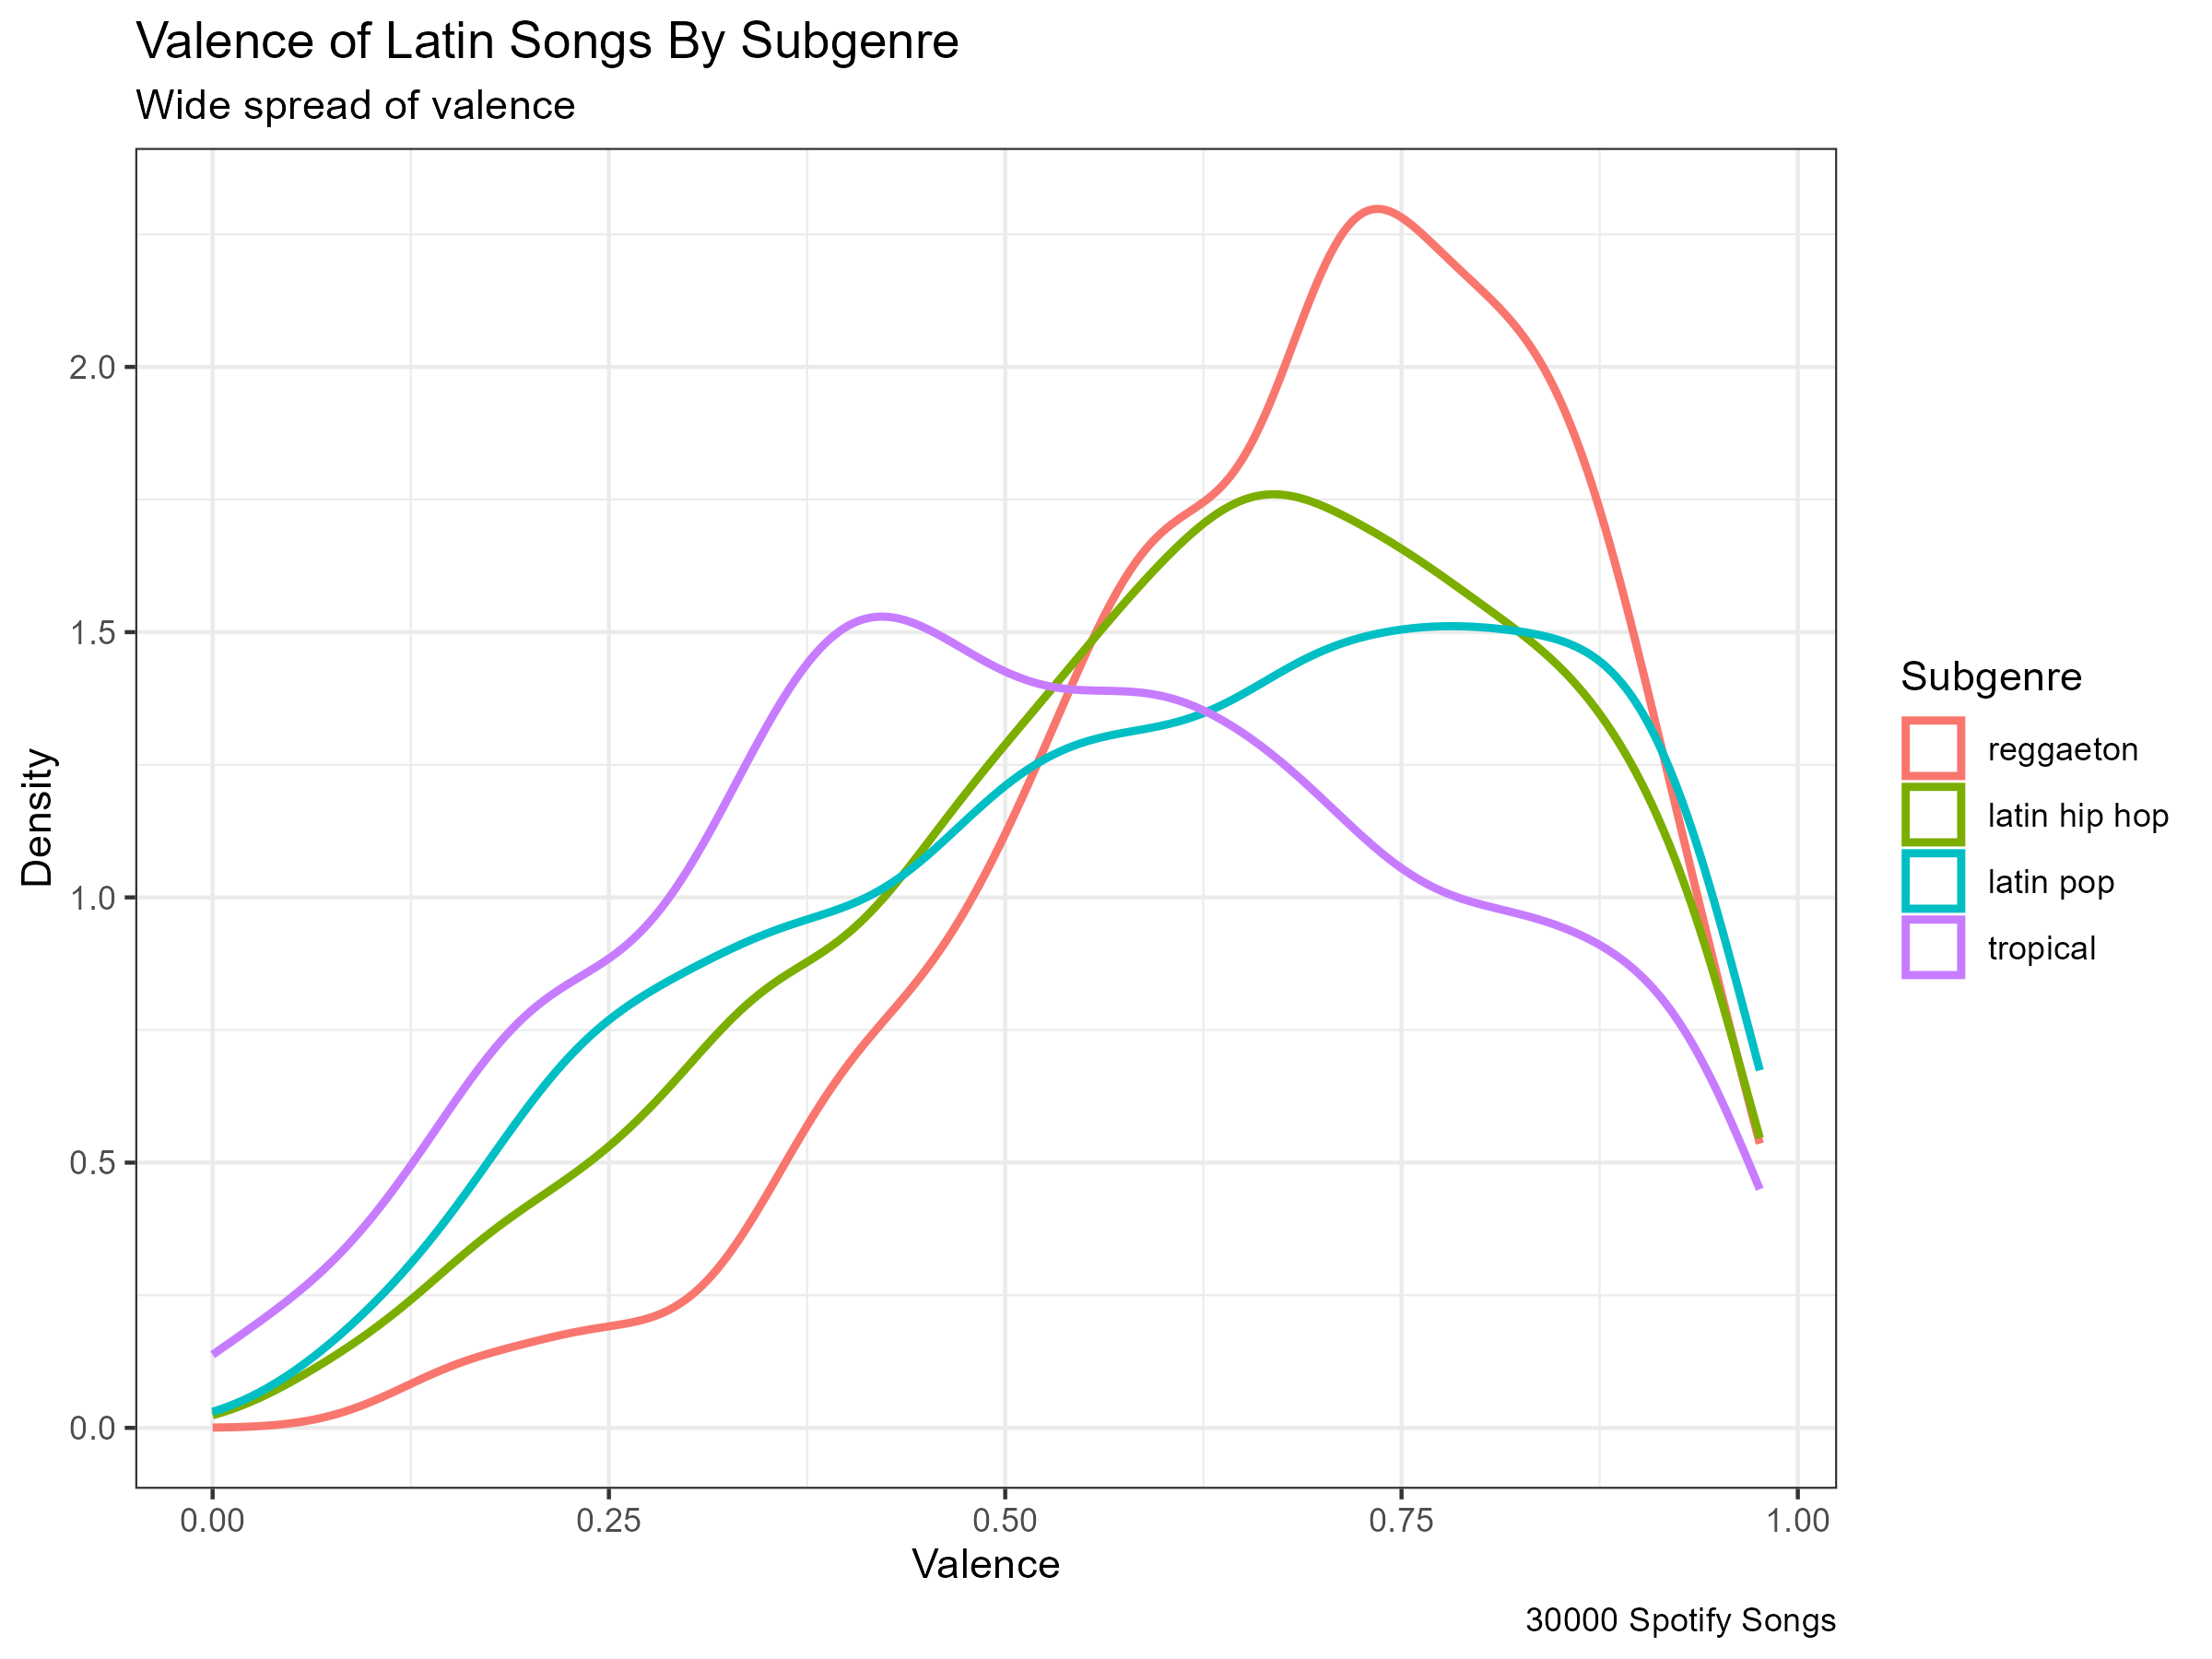
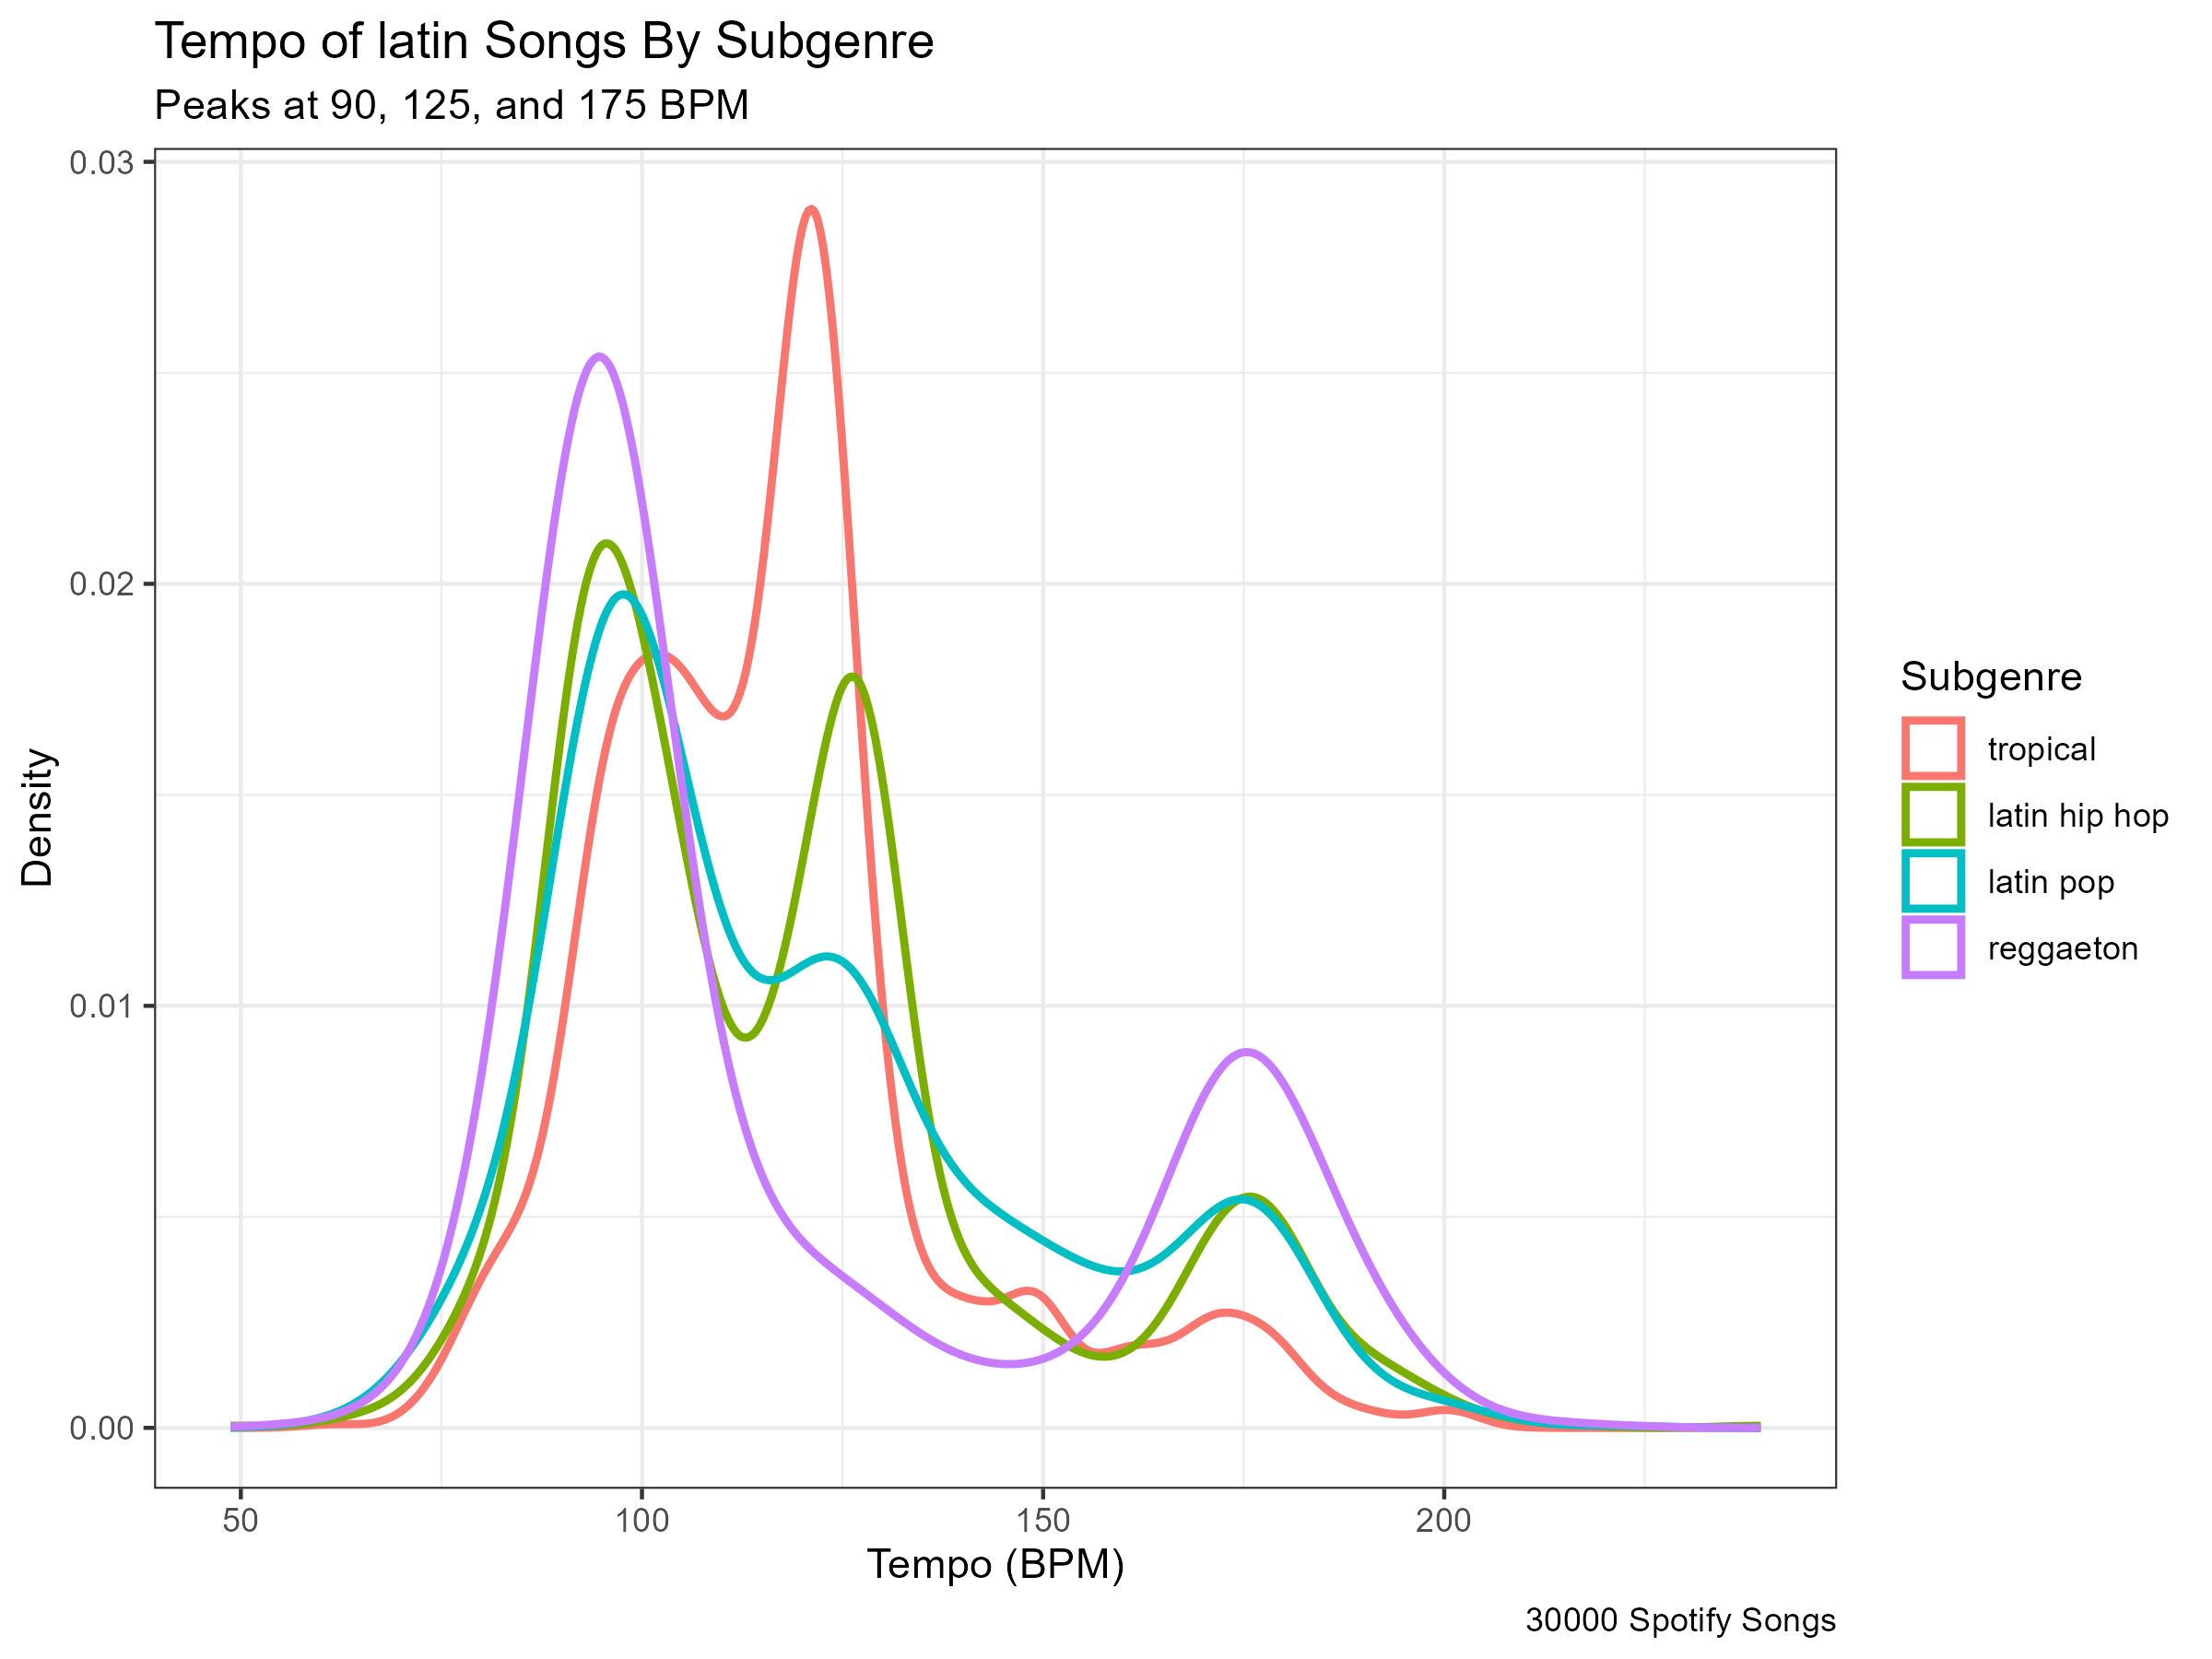
I used the 30000 Spotify Songs dataset from Kaggle to make these plots. These songs are pulled from the Spotify API to represent songs from all of Spotify. I filtered out only the latin songs. All of the following plots are density plots about five variables (popularity, danceability, speechiness, valence, and tempo), seperated by the subgenres of latin.
Plots
Popularity of Latin Songs by Subgenre

Danceability of Latin Songs by Subgenre

Speechiness of Latin Songs by Subgenre

Valence of Latin Songs by Subgenre

Tempo of Latin Songs by Subgenre
