Music Trends Over Time
Data Methodology
The following plots come from a dataset I found in Kaggle, called Top Hits Spotify from 2000-2019. It contains 2000 songs on Spotify from 2000 to 2019, although there were also some songs from 1999 that I included. It contains multiple different variables for each song, such as the ones listed in the “Home” page.
Plots
Number of Top Spotify Songs Over Time By Genre

This line graph shows the number of top songs for various genres. This could be used to determine popularity because the graph was produced using the top songs for each year. We can see that Dance/Electronic songs became popular at around 2010, and pop songs stayed well above other songs.
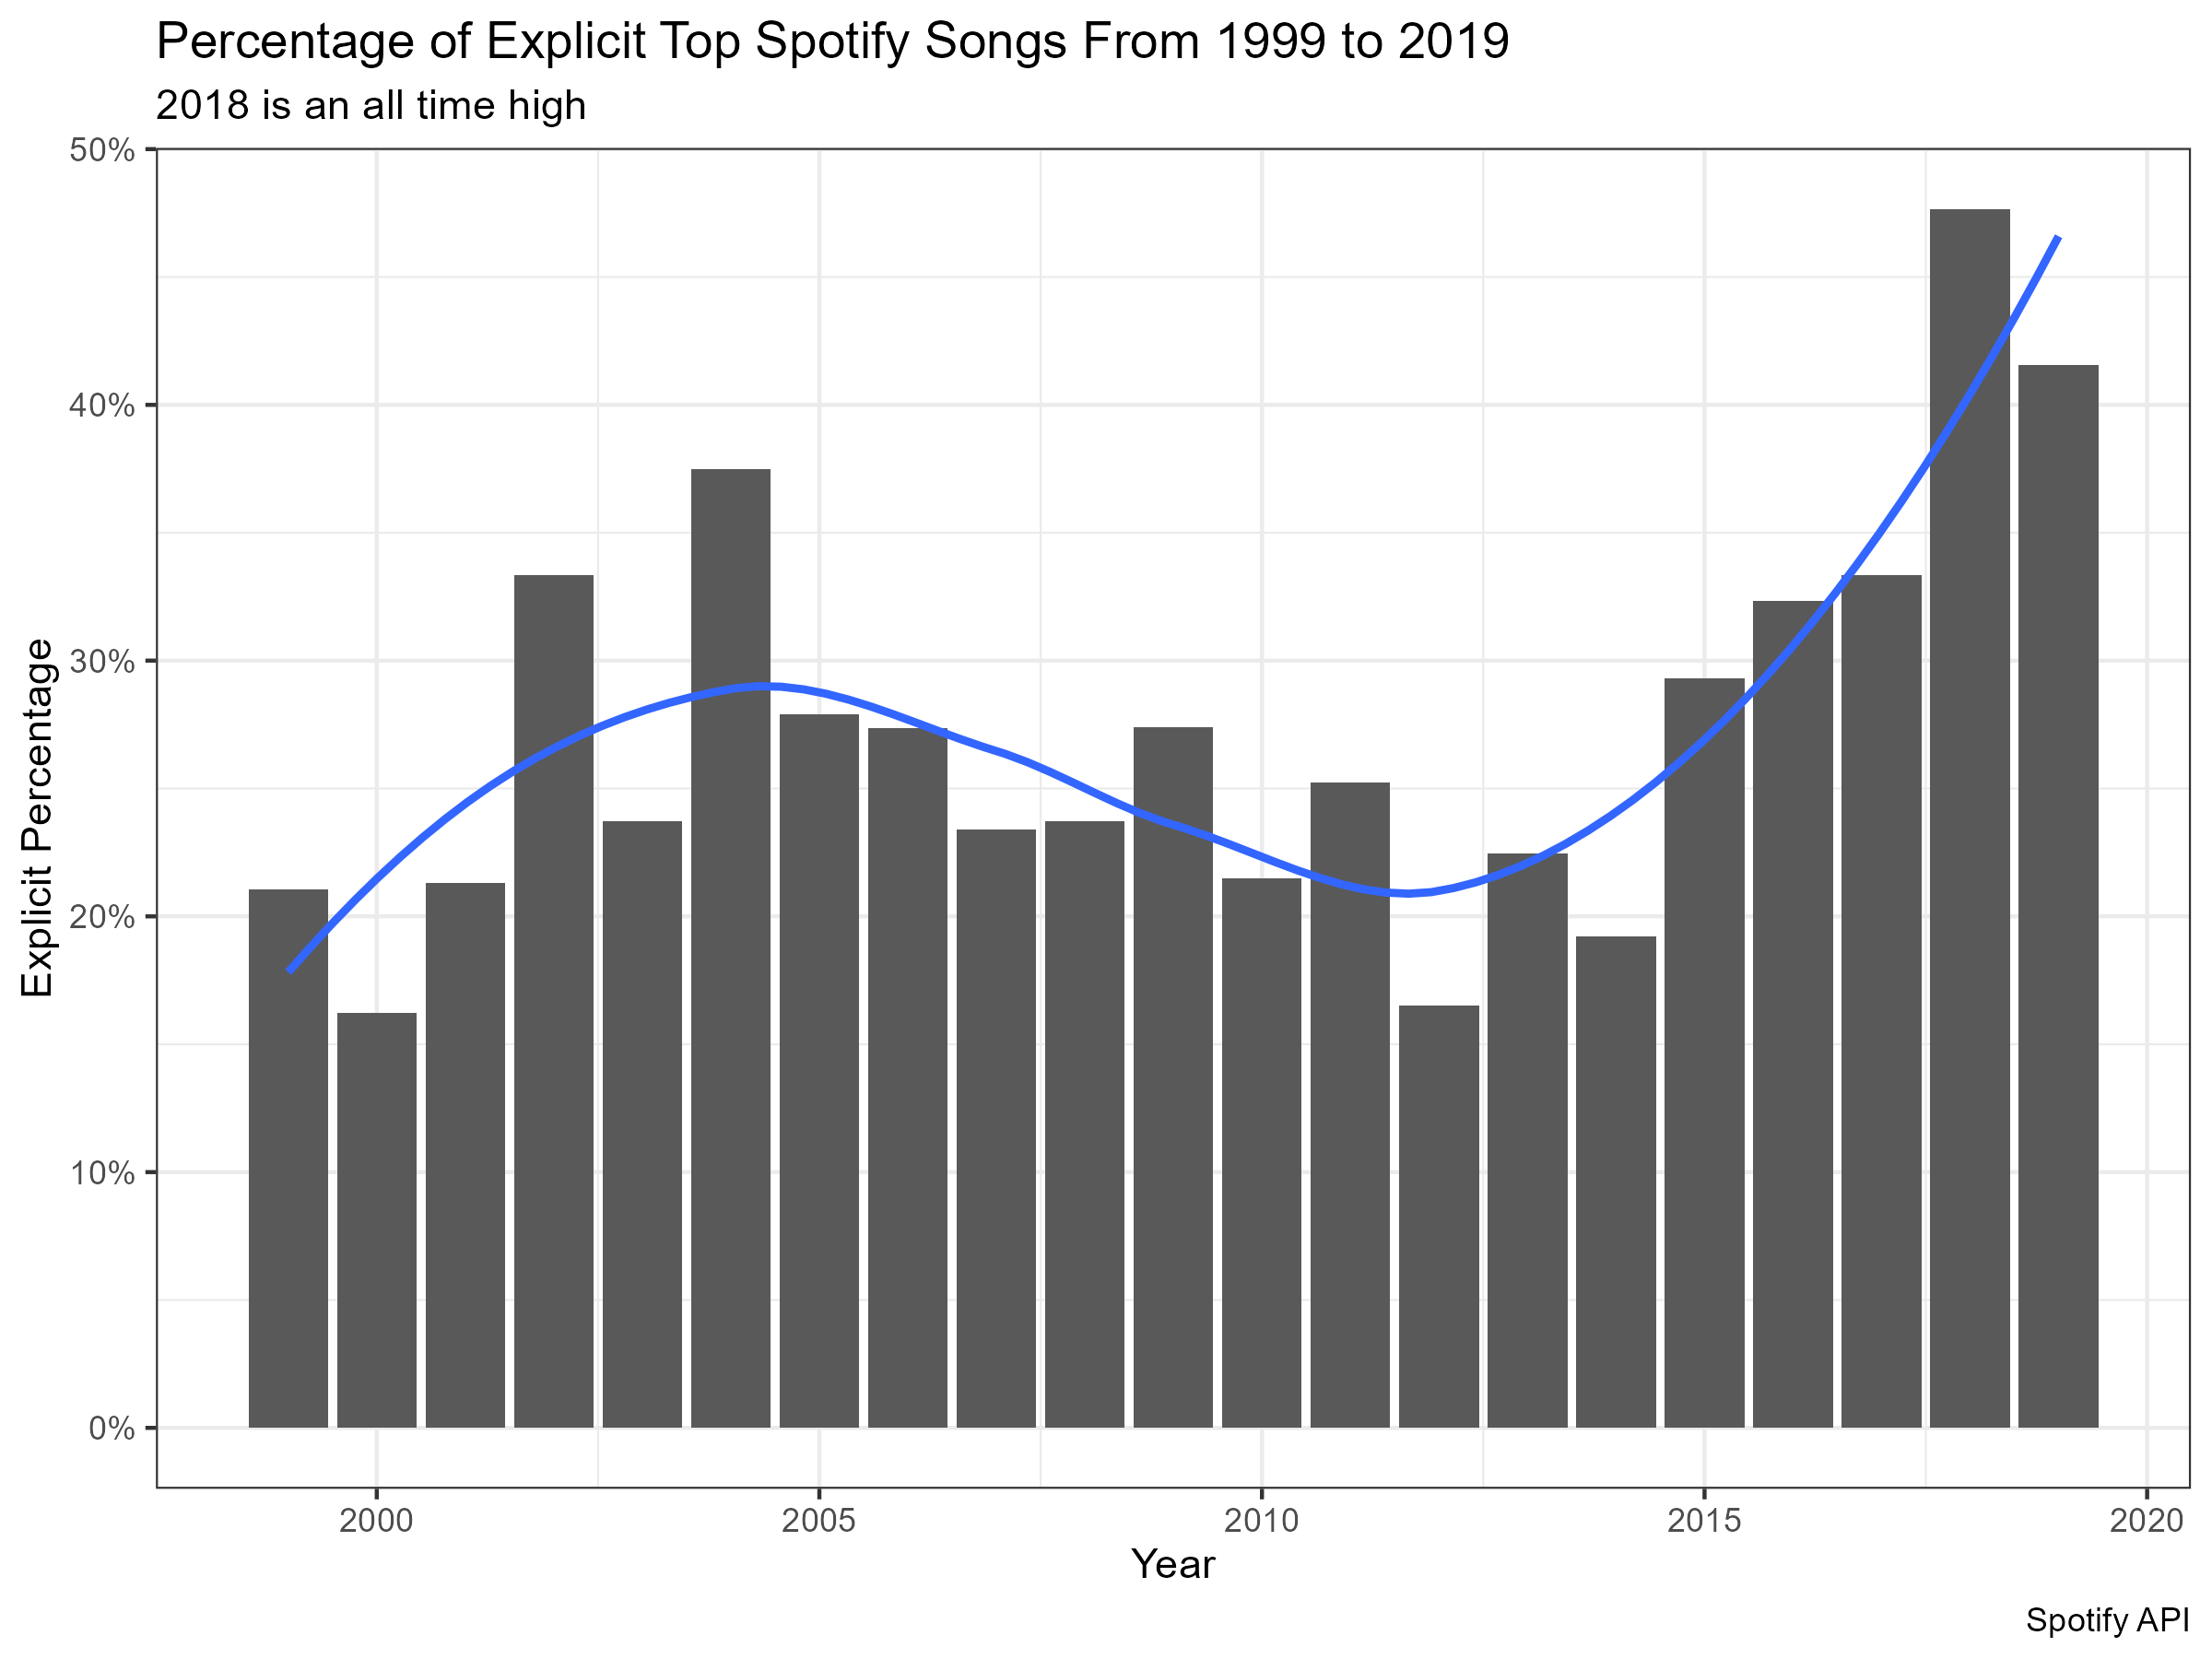
Percentage of Explicit Top Spotify Songs From 1999 to 2019
 This graph shows the trend of explicit songs. We are expected to have more than 50% explicit songs in the upcoming years.
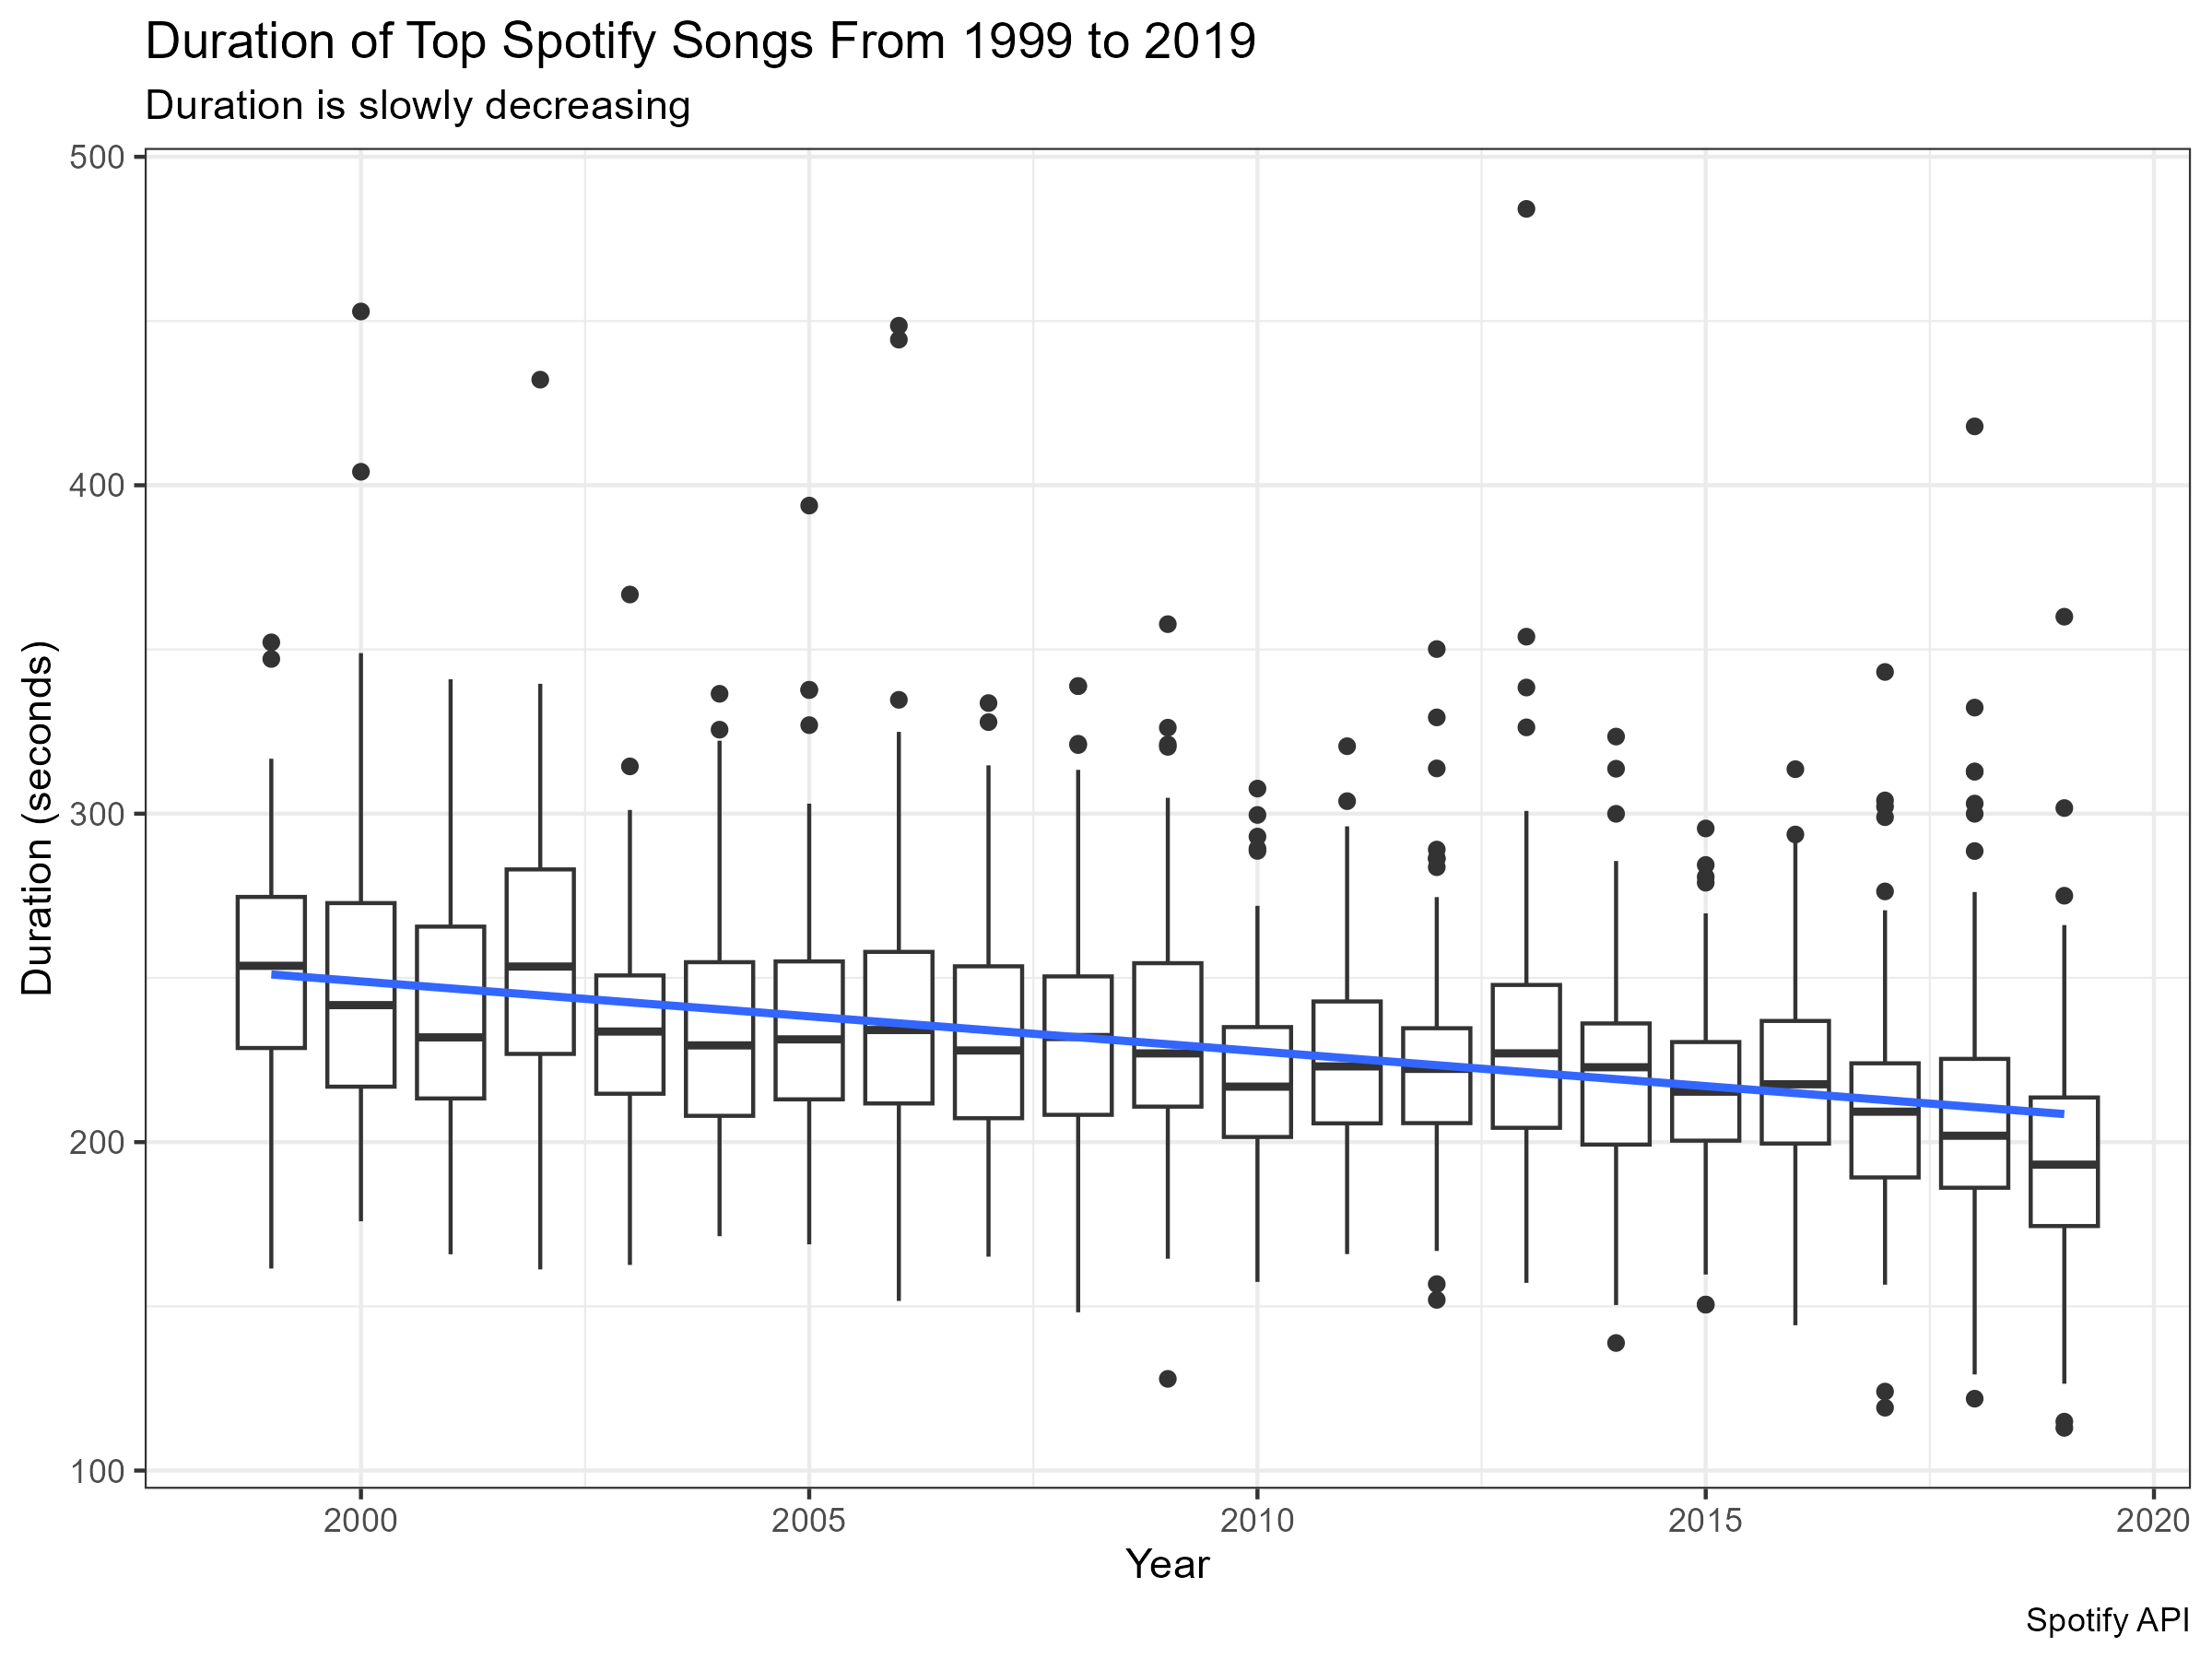
Duration of Top Spotify Songs From 1999 to 2019
 Songs are getting shorter.
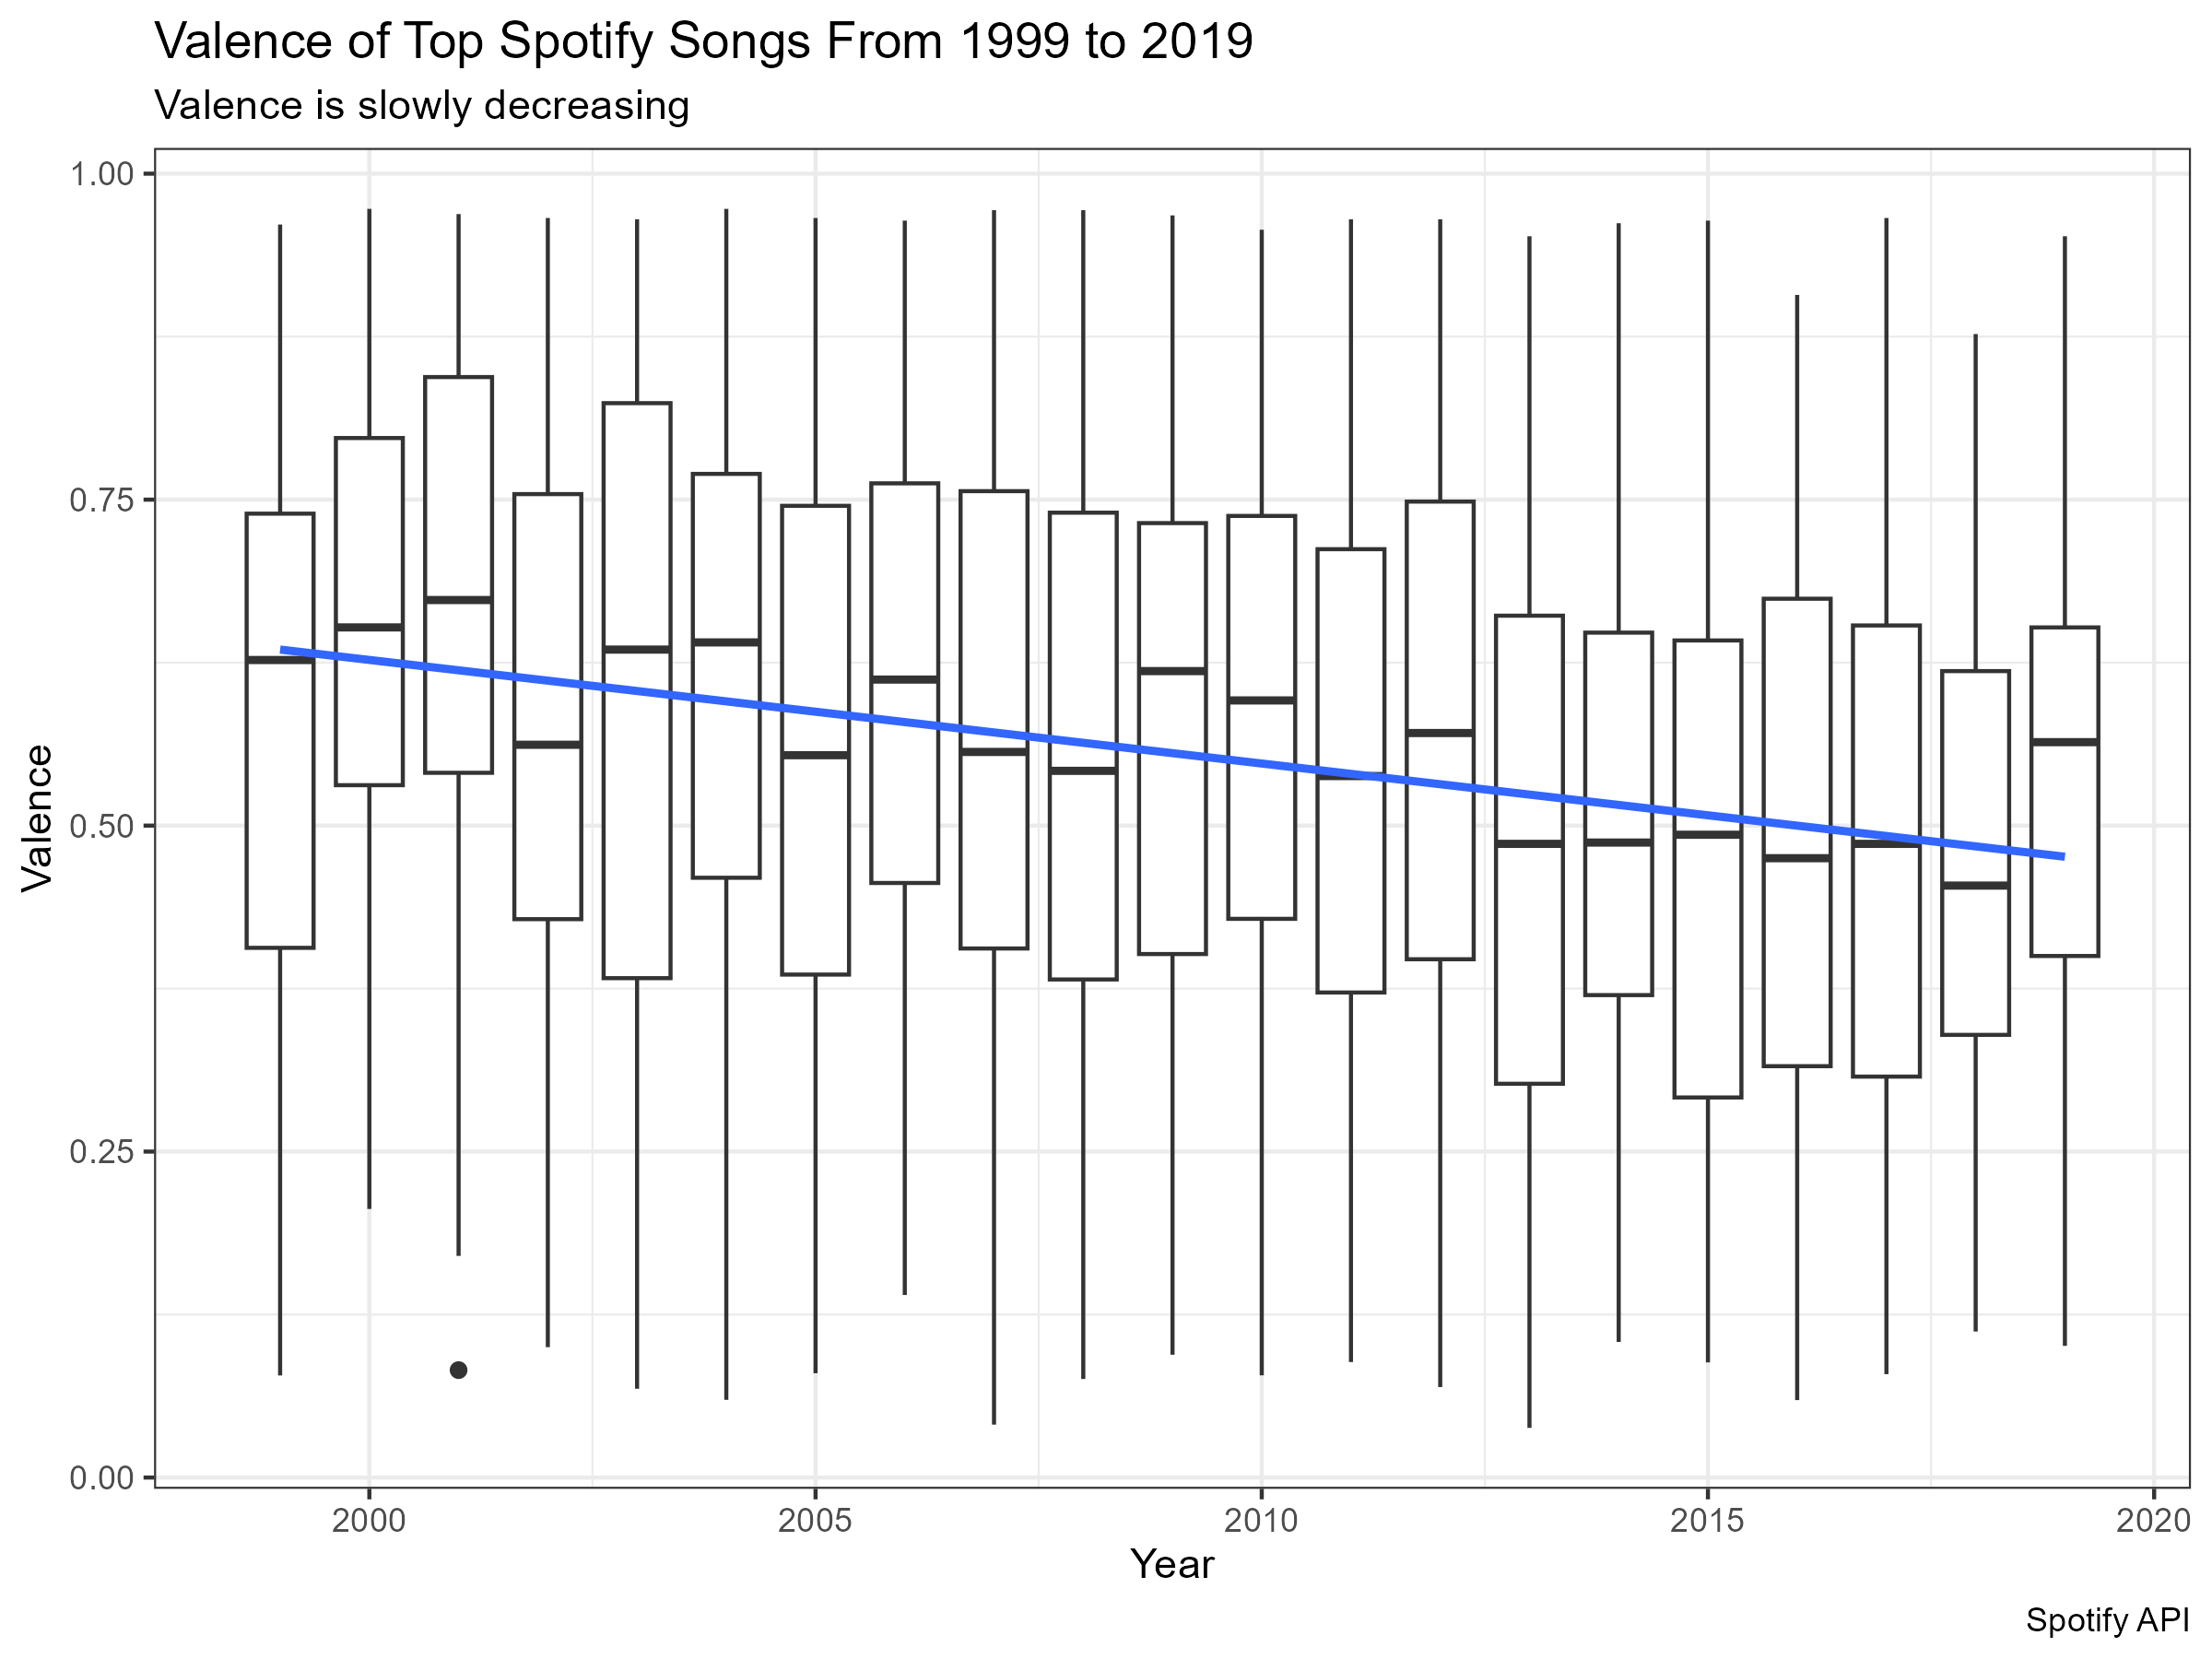
Valence of Top Spotify Songs From 1999 to 2019
 Songs are getting more angry/sad.