R&B
Data Methdology
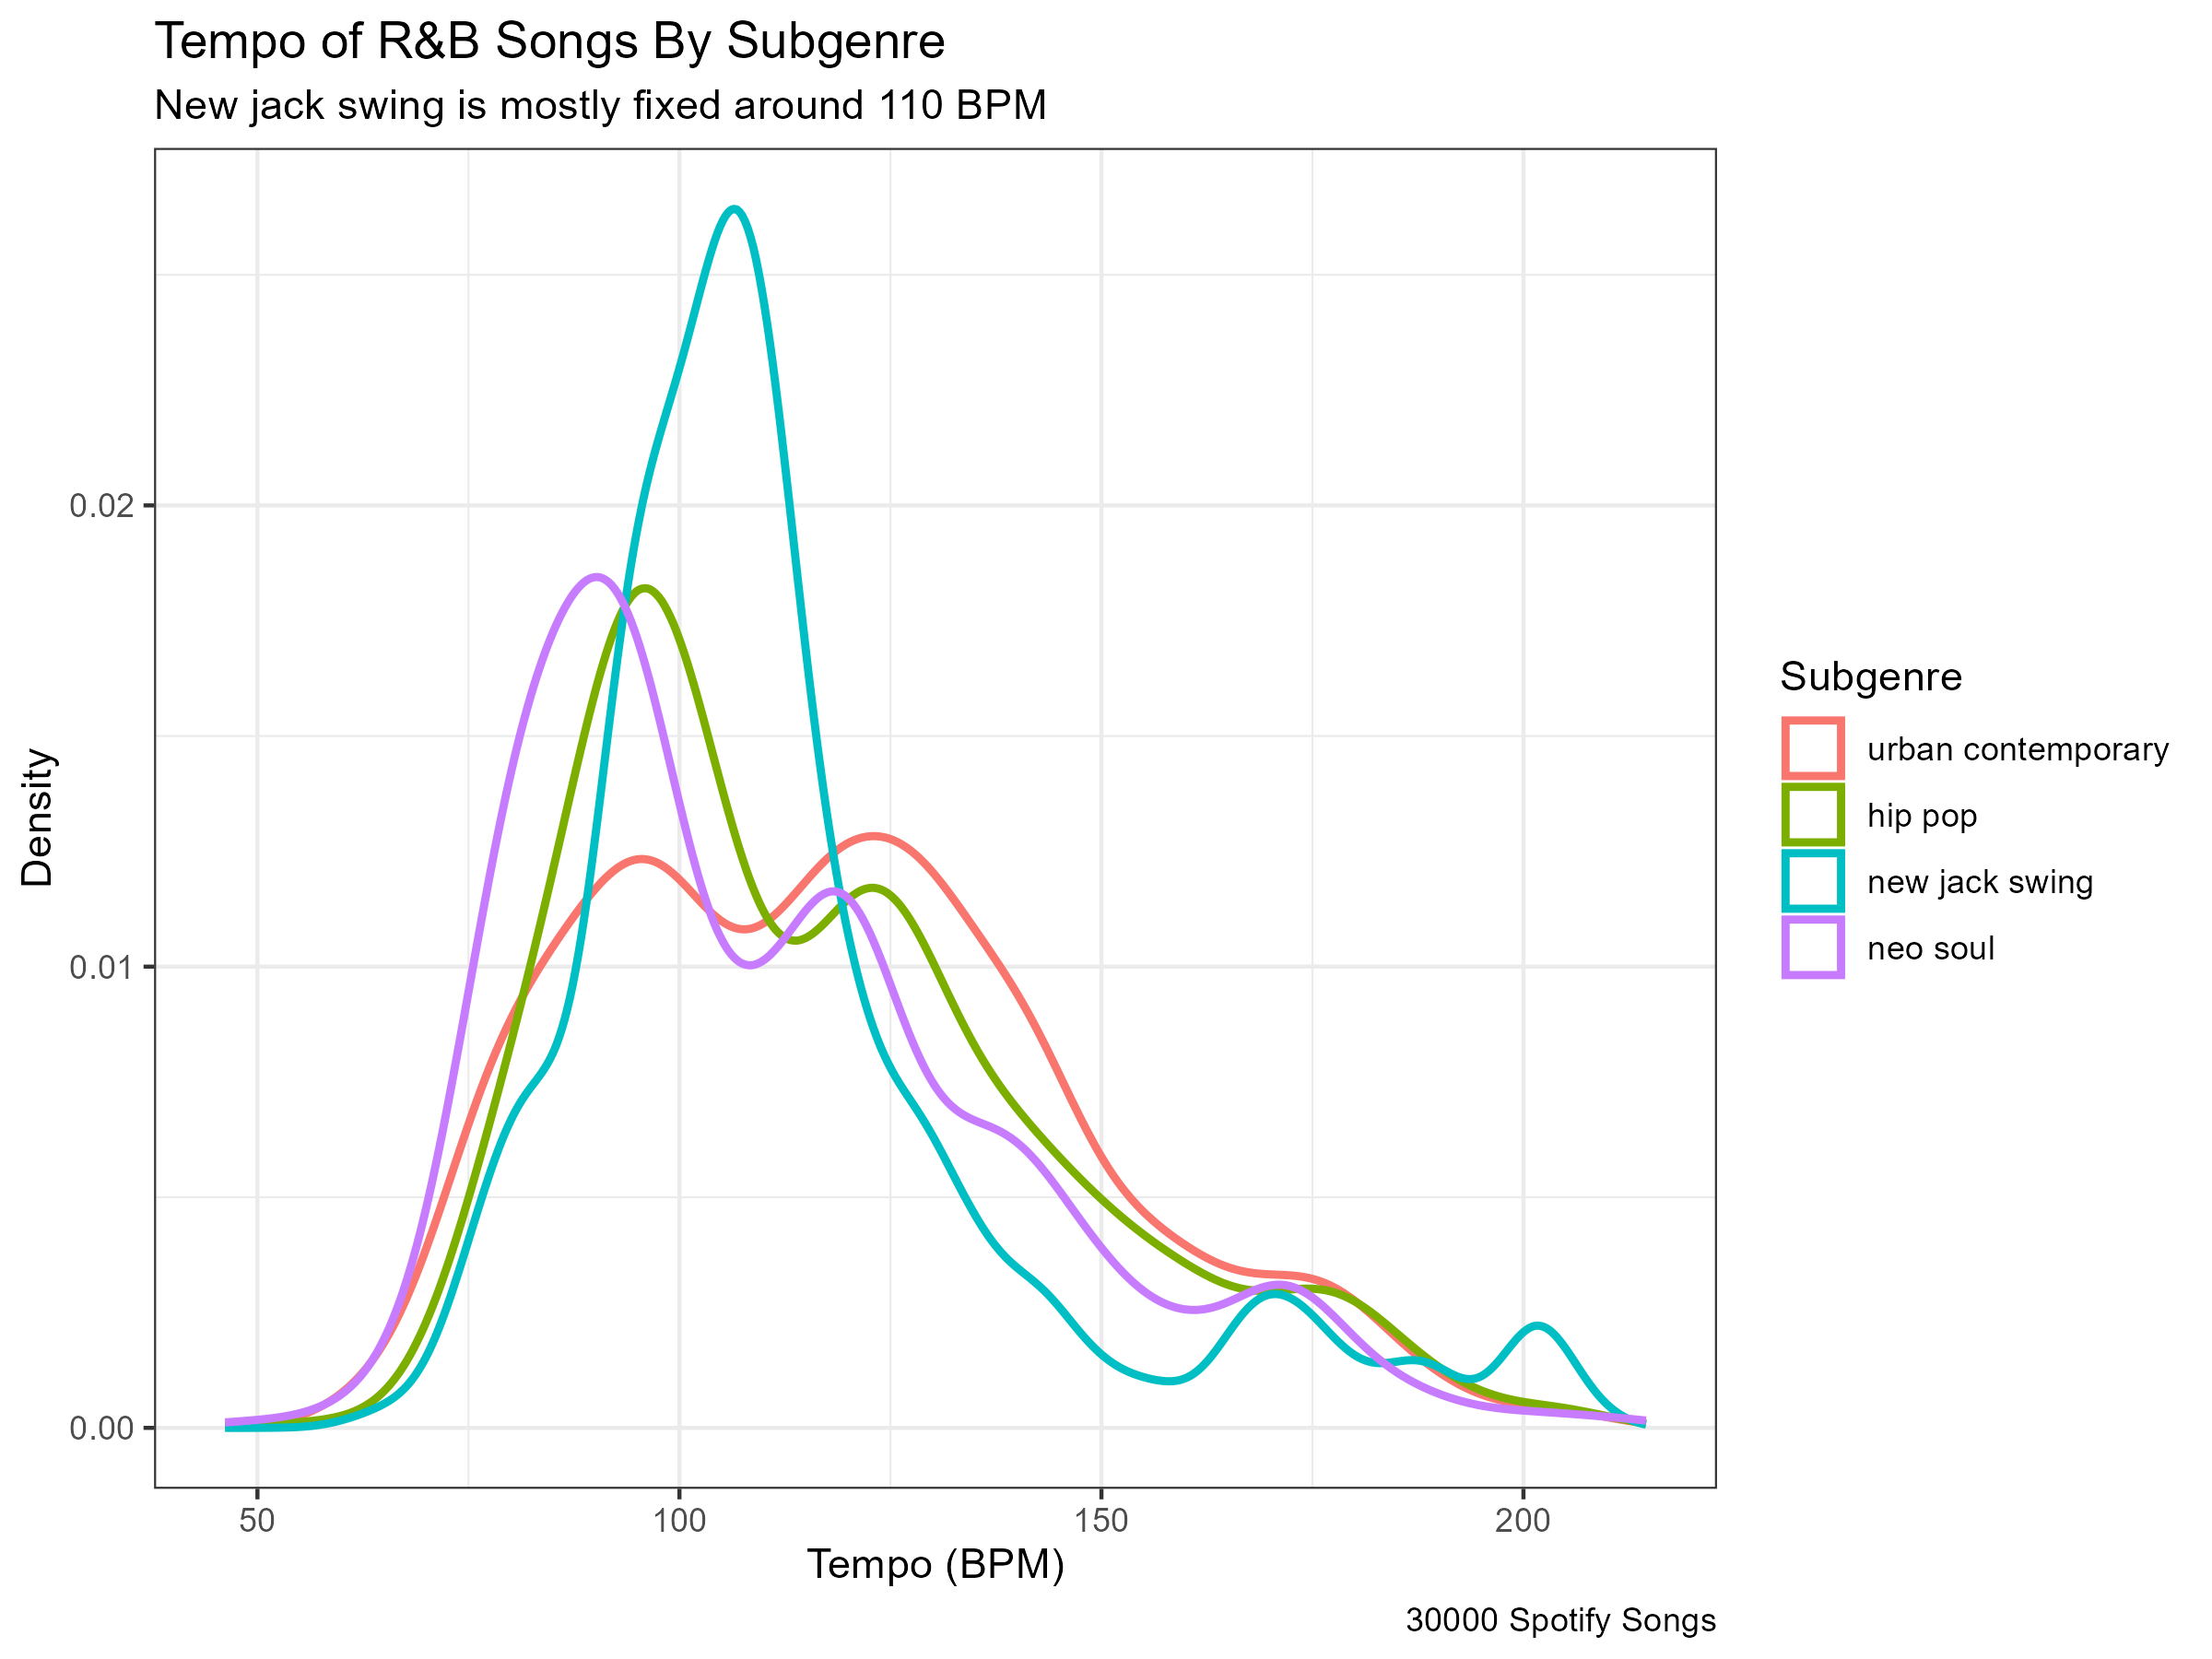
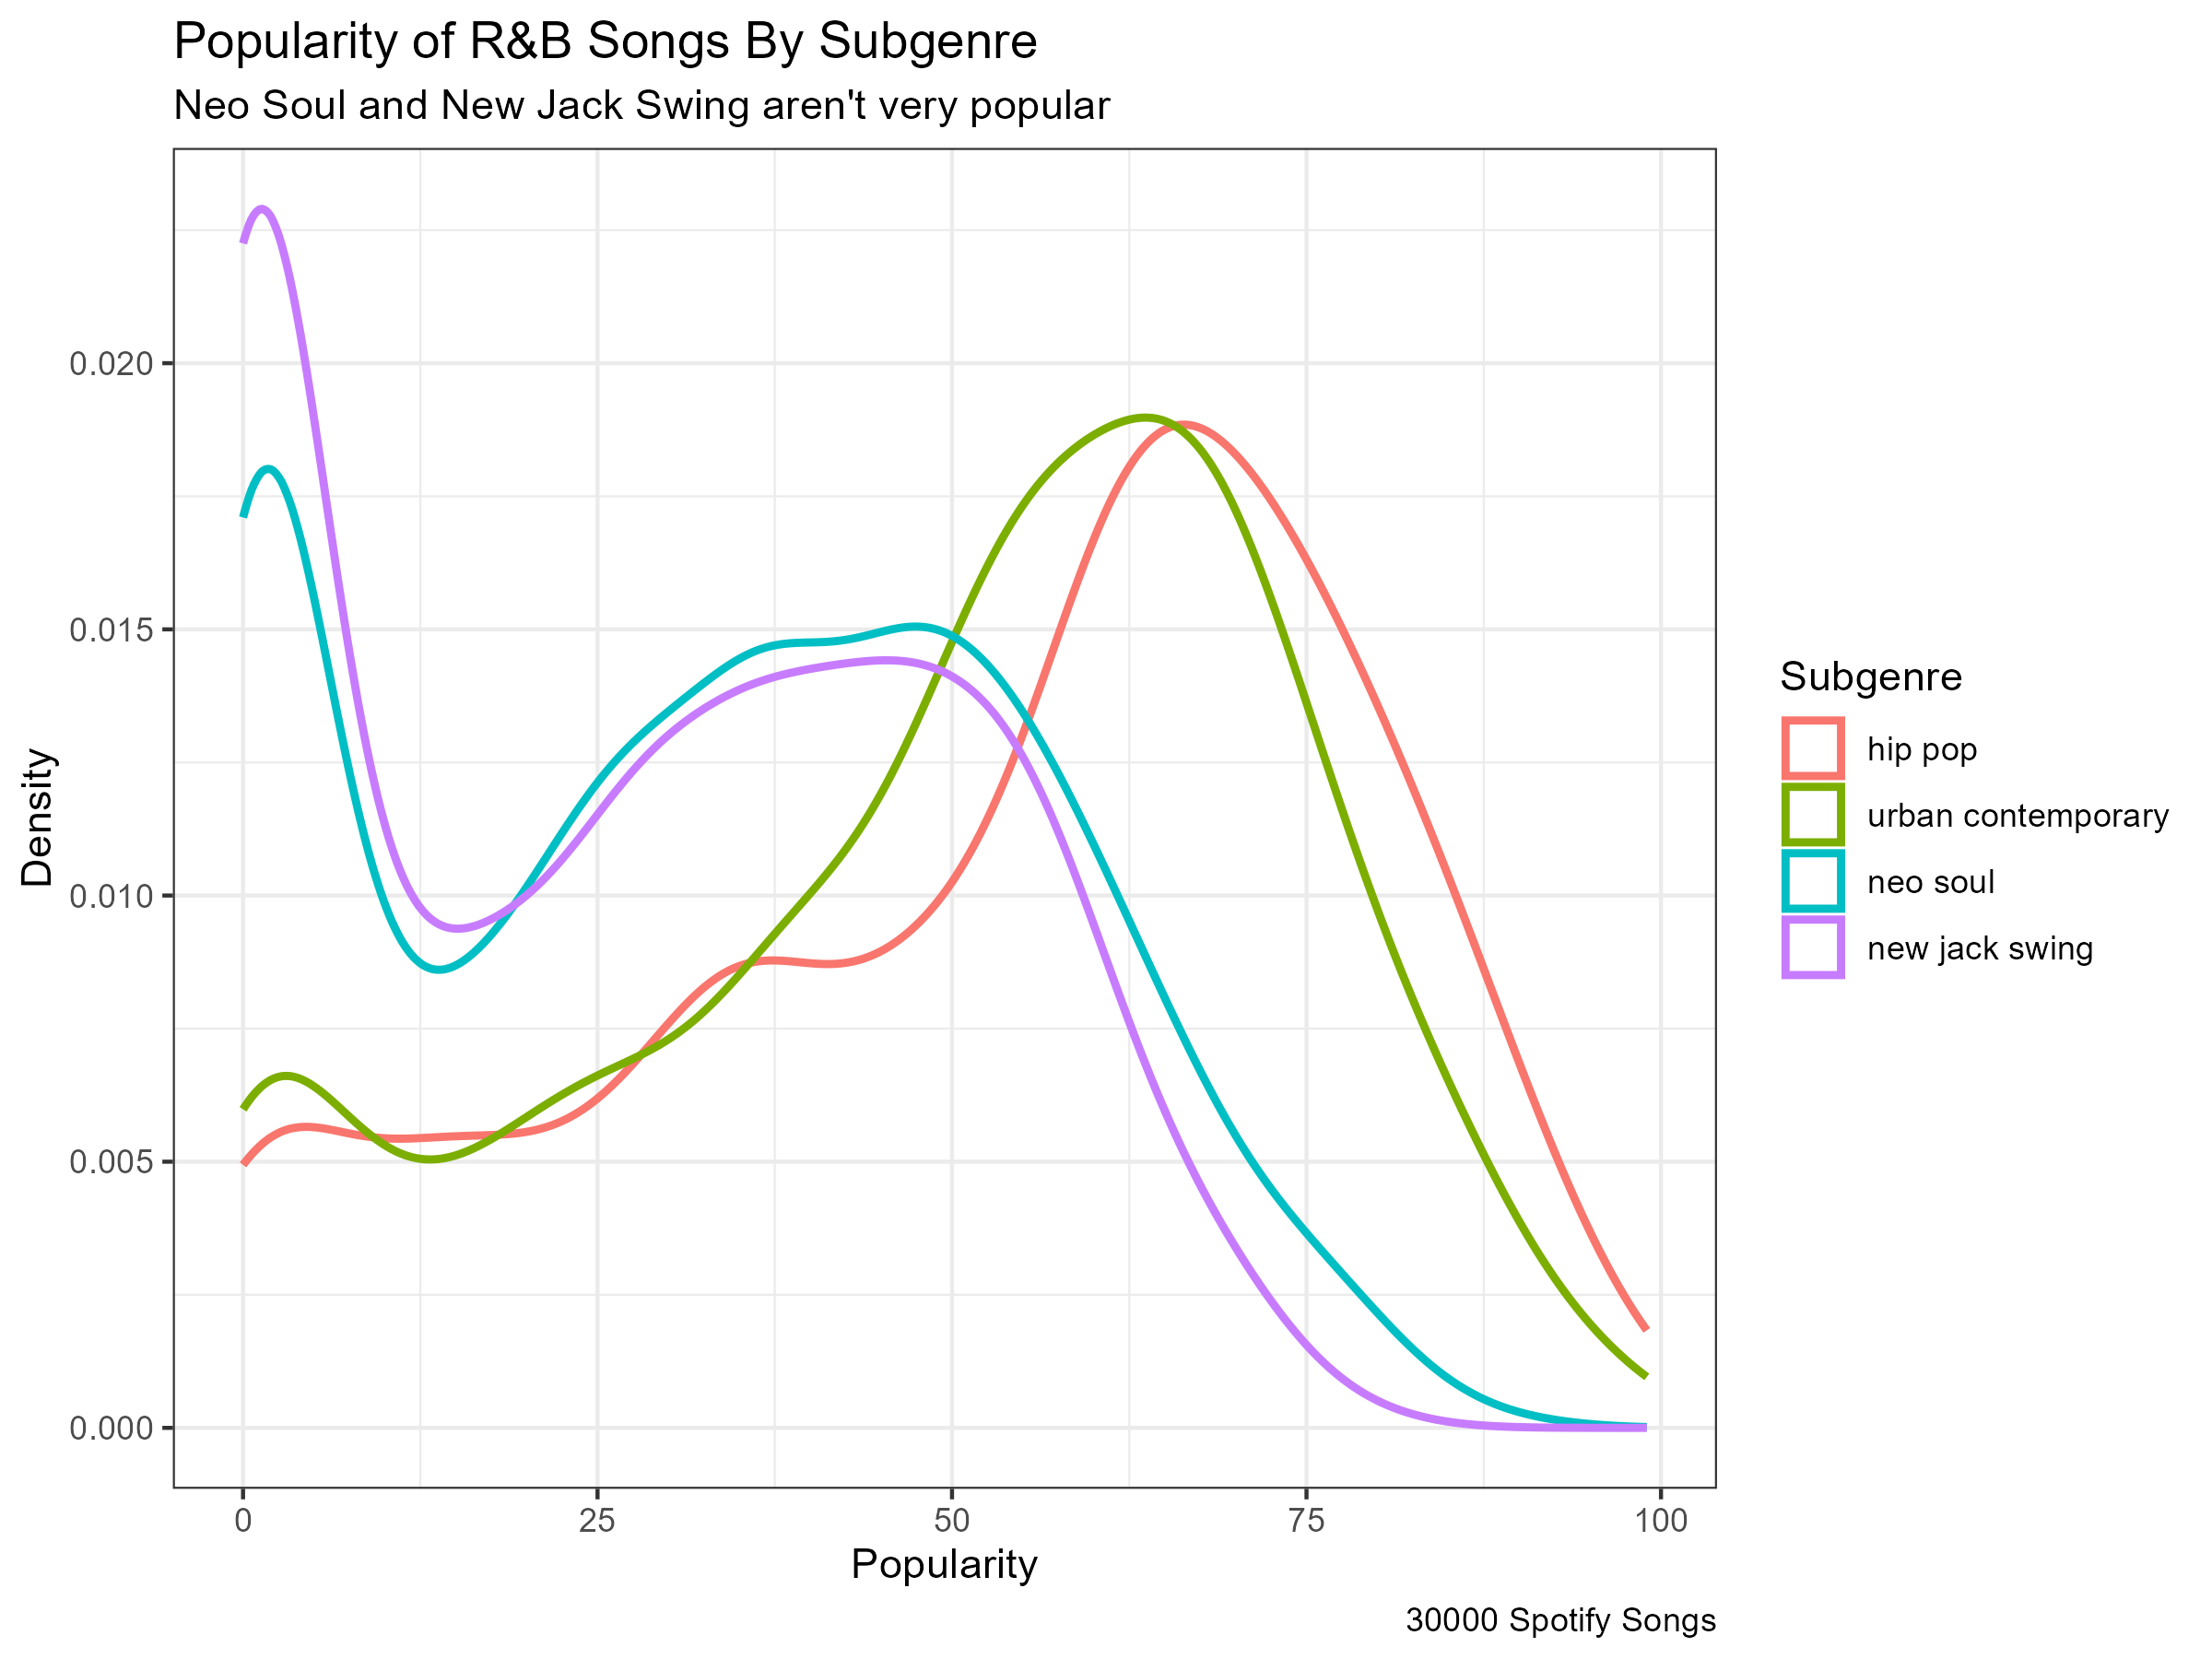
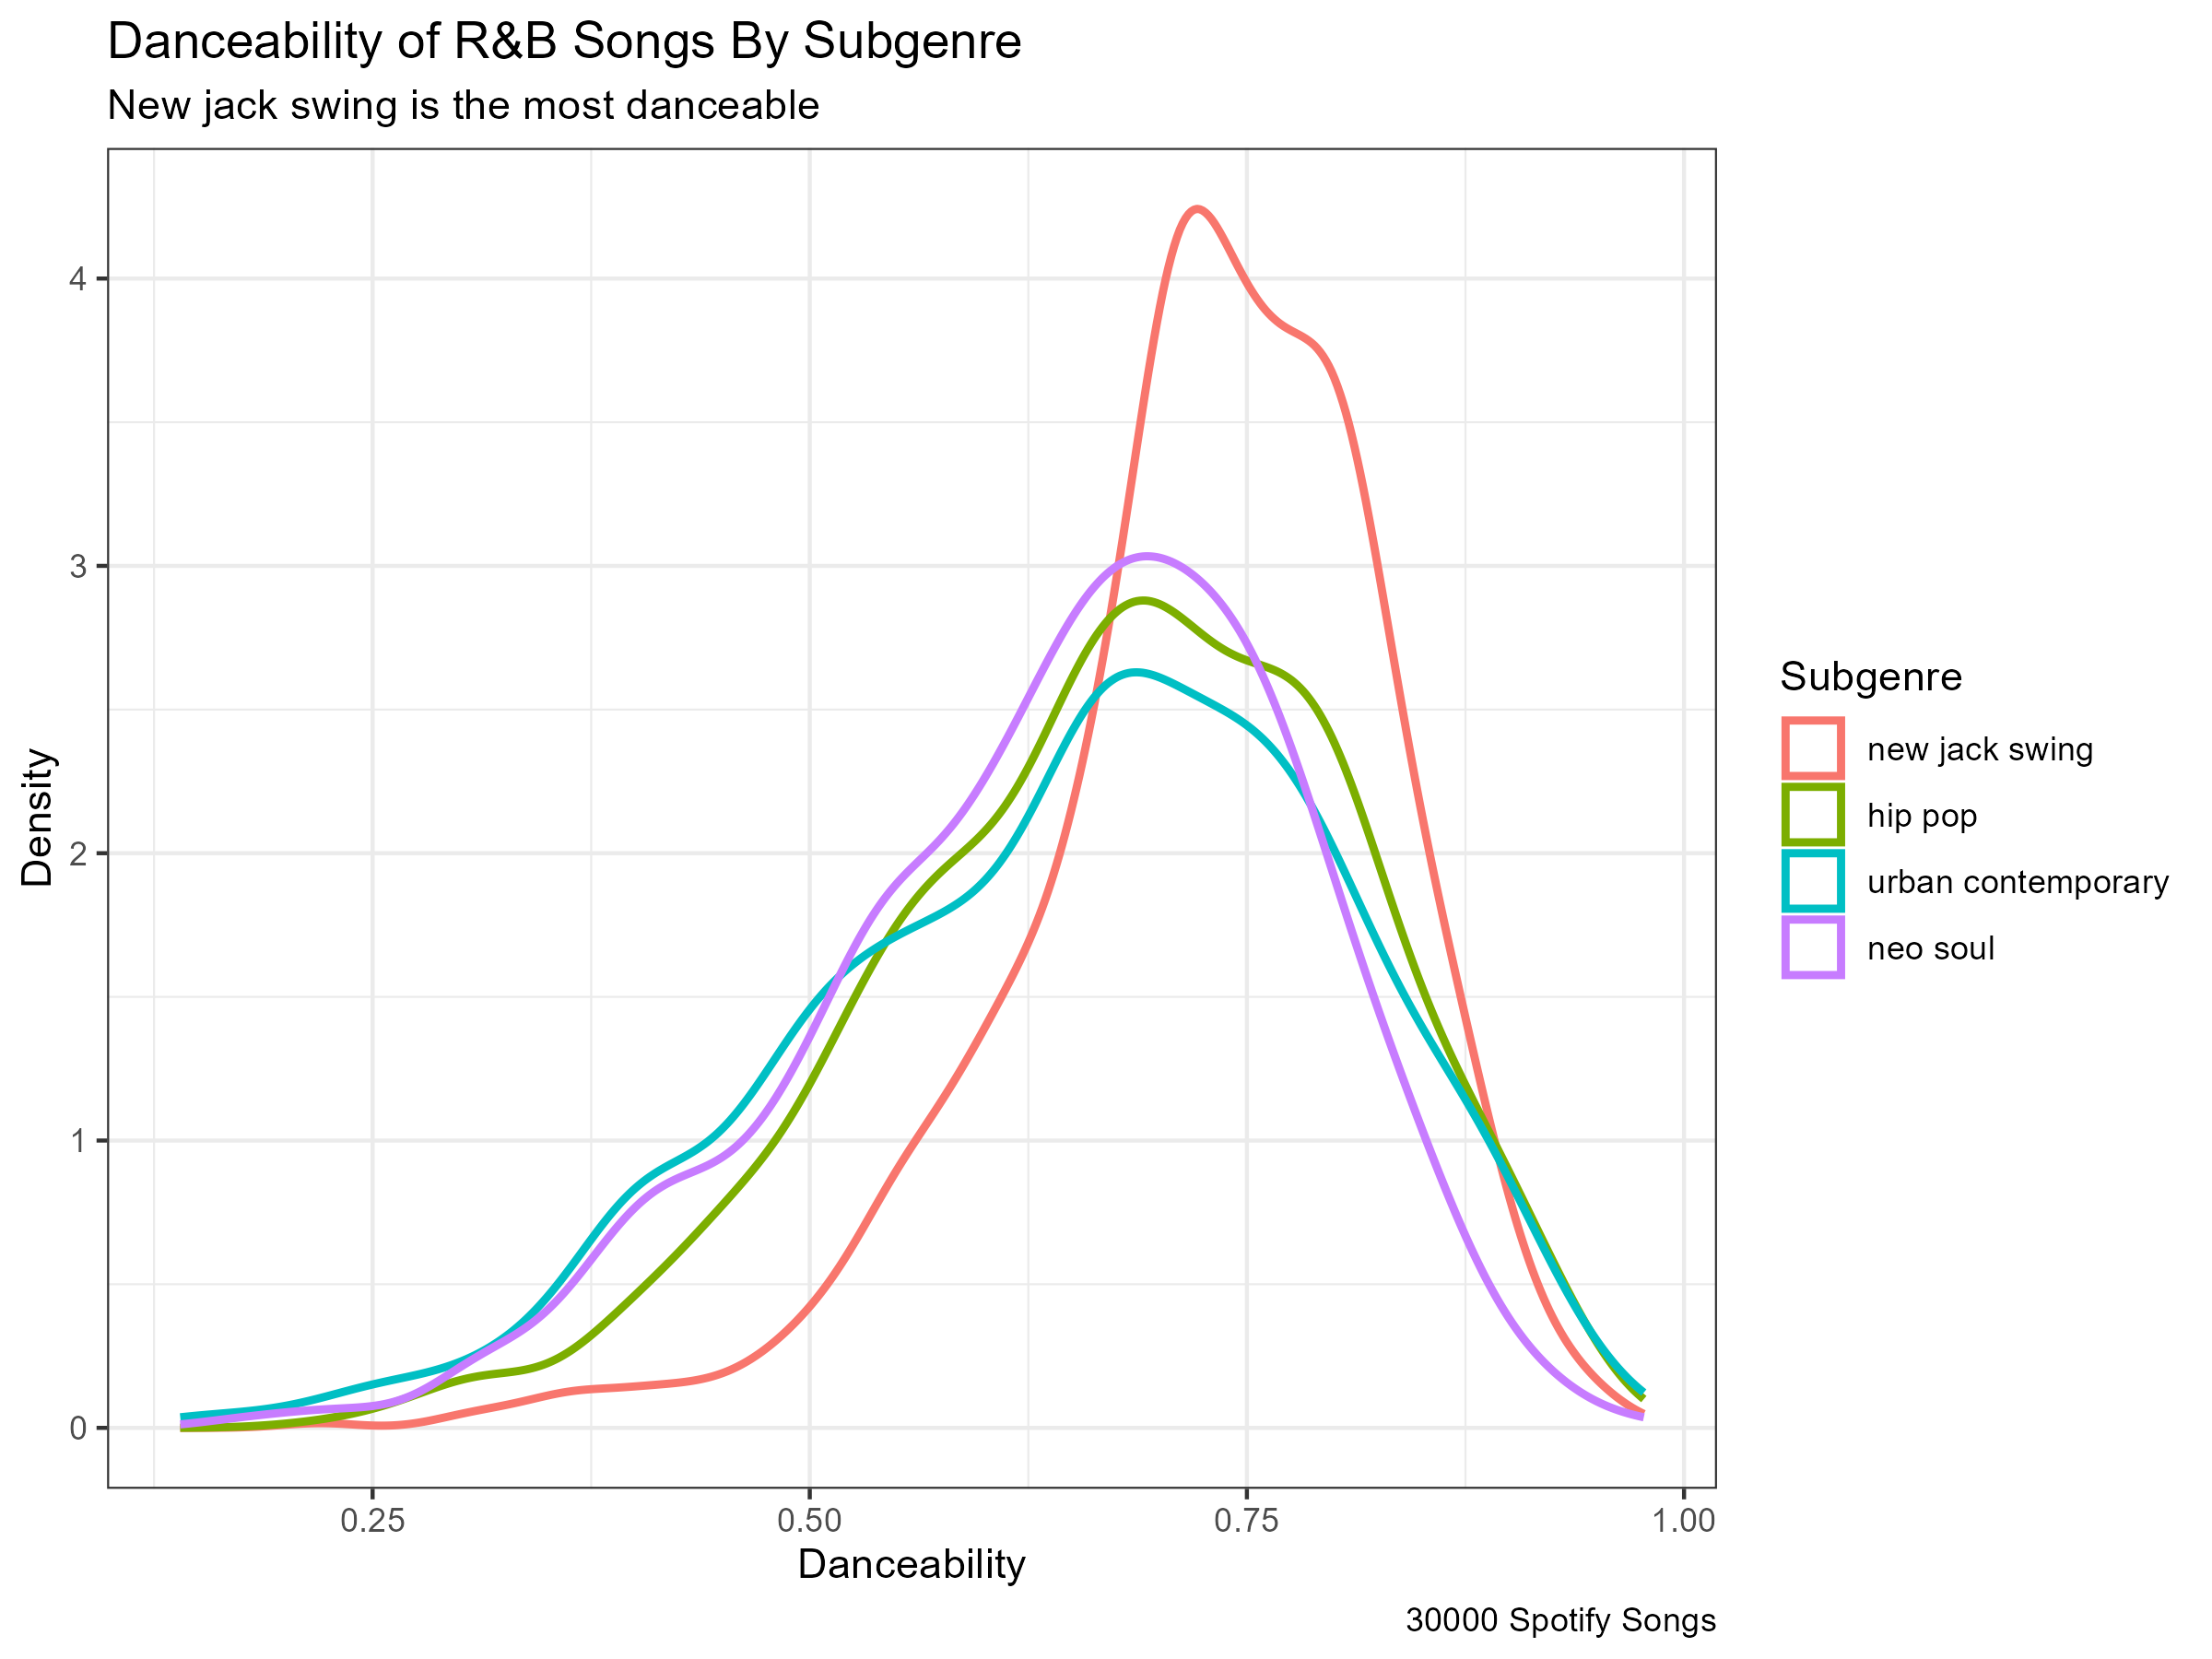
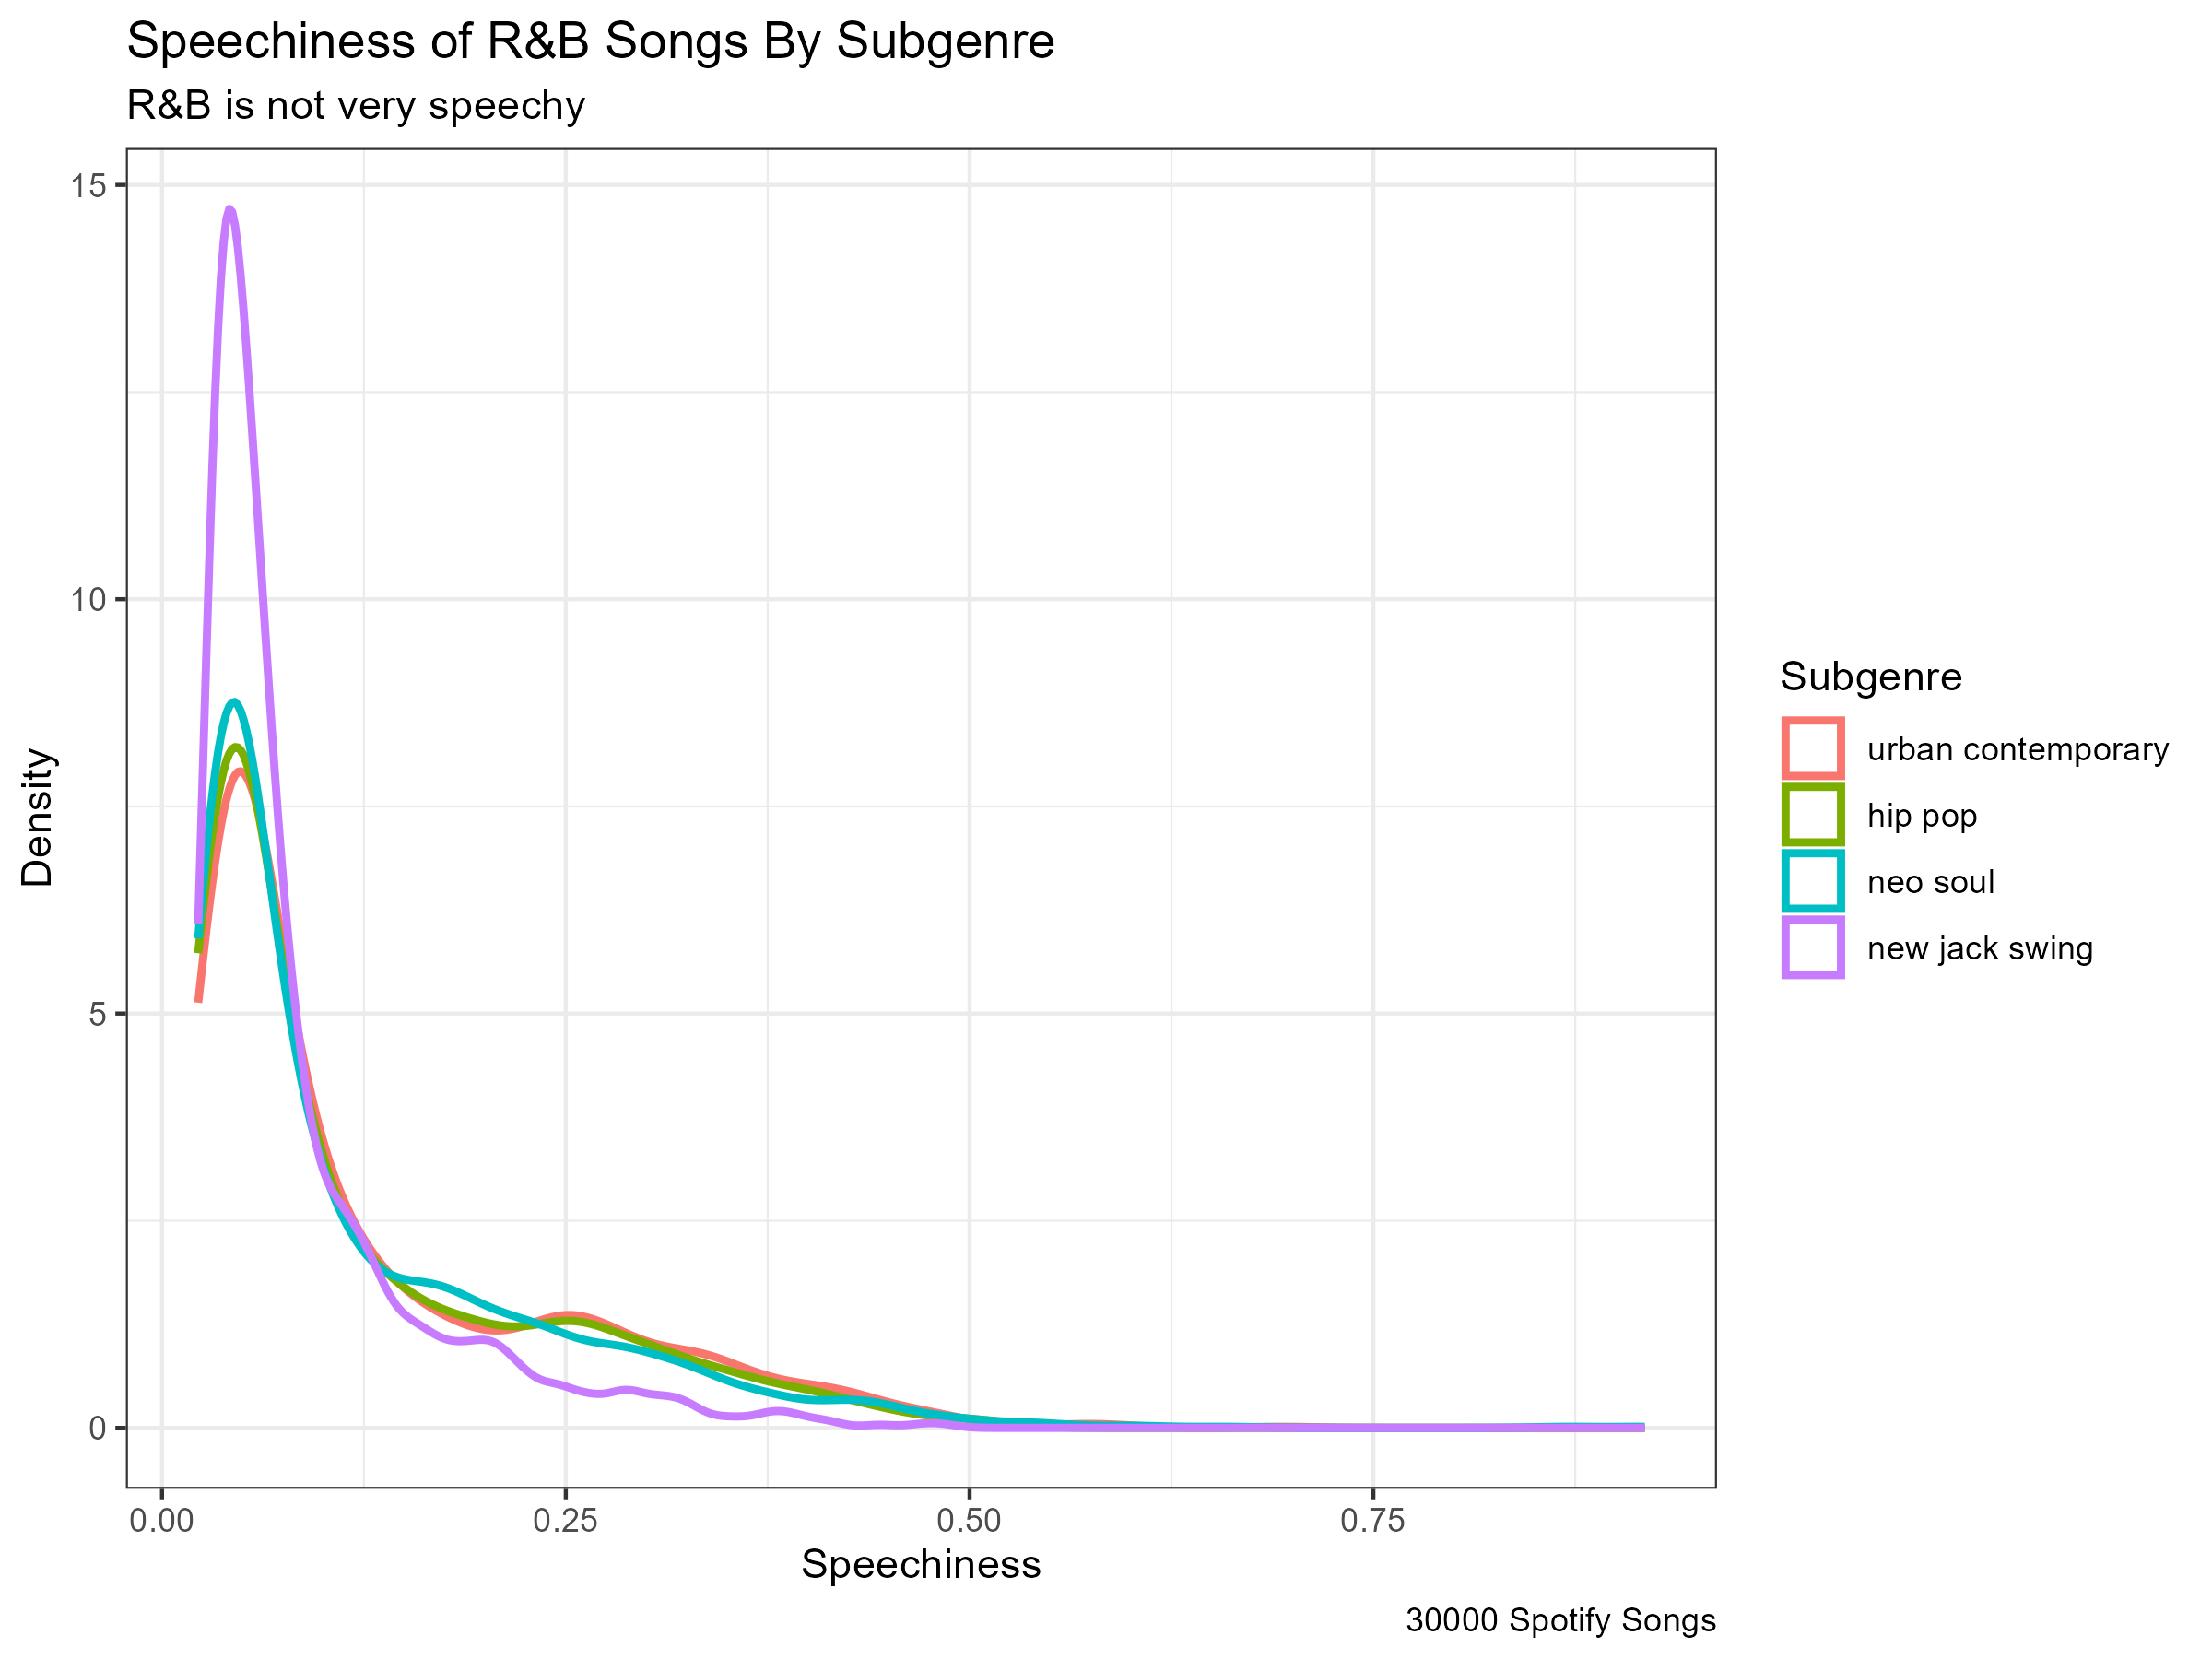
I used the 30000 Spotify Songs dataset from Kaggle to make these plots. These songs are pulled from the Spotify API to represent songs from all of Spotify. I filtered out only the R&B songs. All of the following plots are density plots about five variables (popularity, danceability, speechiness, valence, and tempo), seperated by the subgenres of R&B.
Plots
Popularity of R&B Songs by Subgenre
Danceability of R&B Songs by Subgenre
Speechiness of R&B Songs by Subgenre
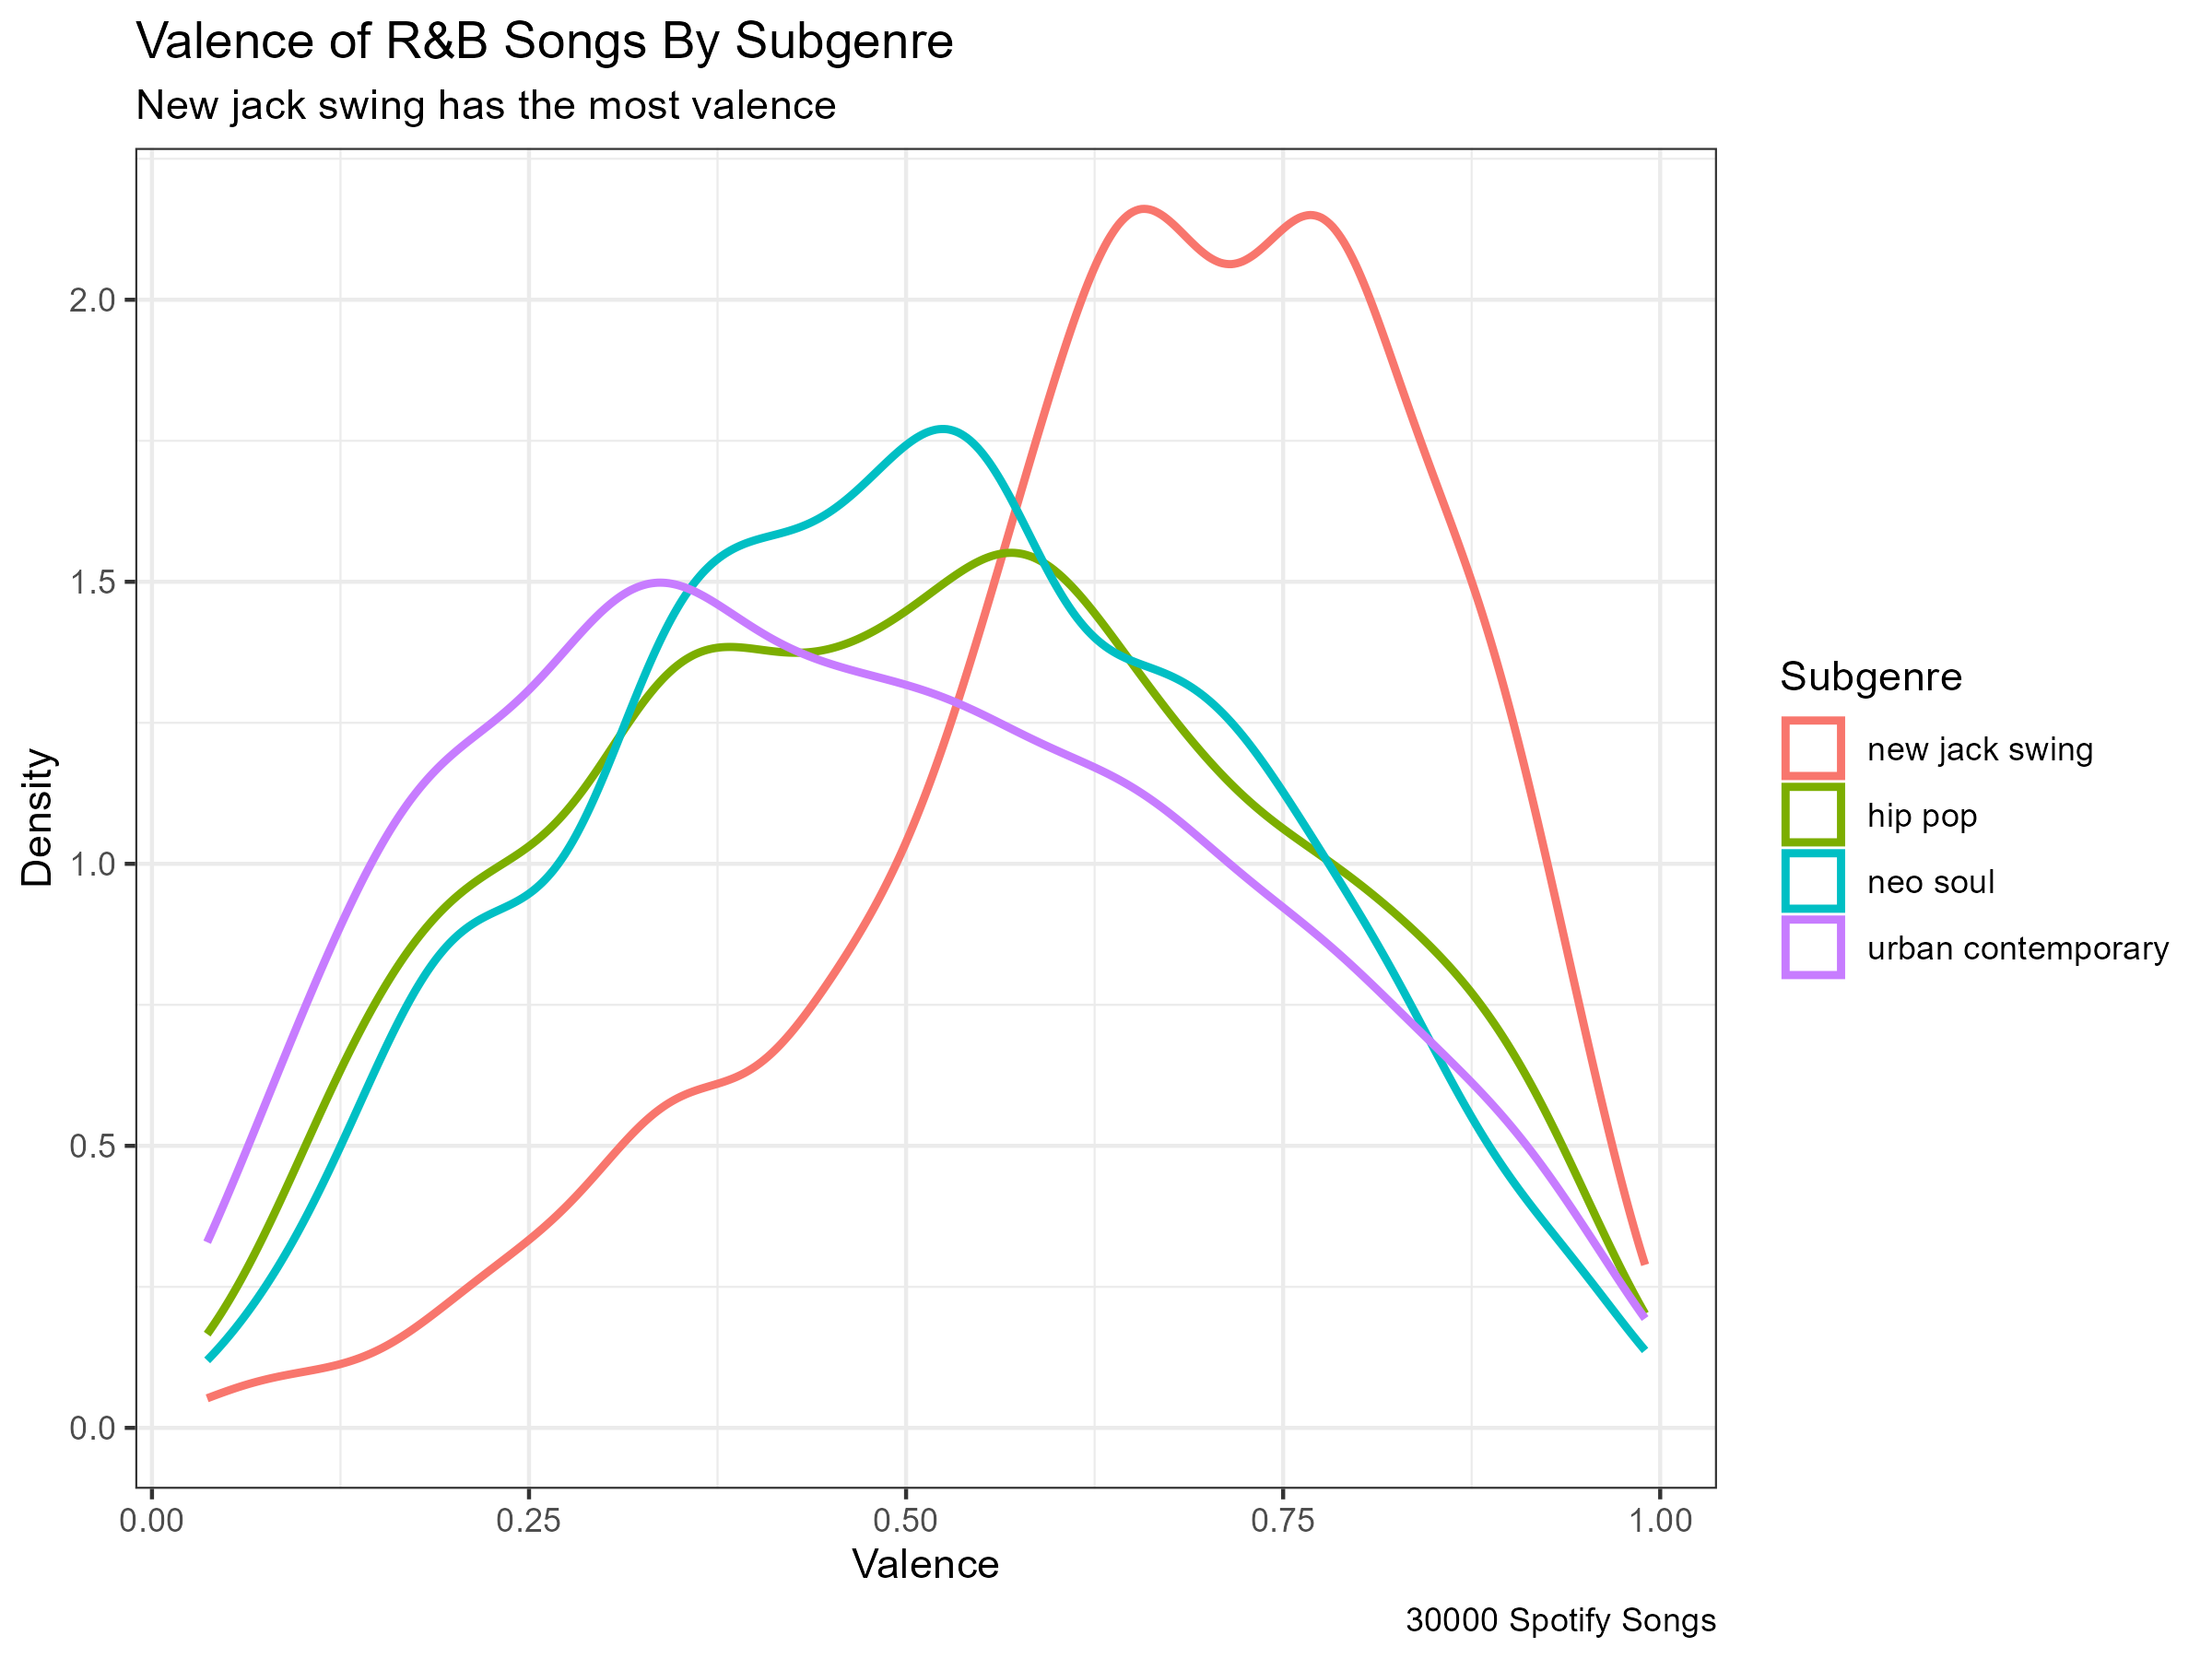
Valence of R&B Songs by Subgenre
Tempo of R&B Songs by Subgenre
